Vol. 27, Issue 3, January 31, 2011 – PDF version
Jose G. Peña, Texas AgriLife Extension Economist-Management
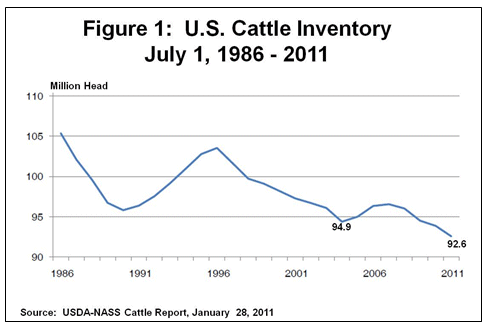
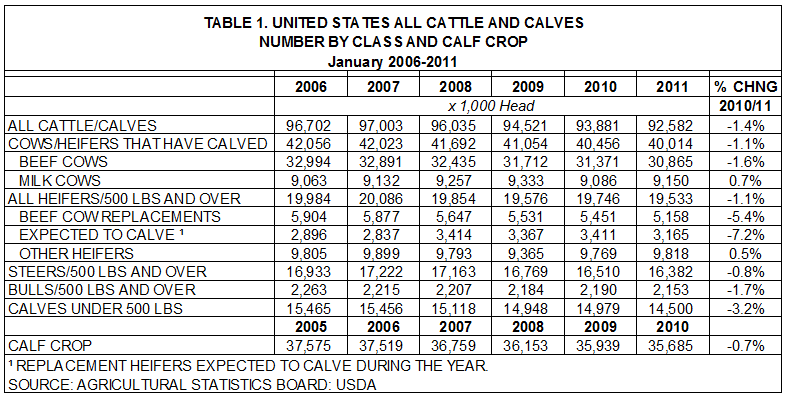
According to USDA’s January 28, 2011 Cattle Report, the U.S. cattle inventory decreased for the fourth year in a row after three years of slight inventory increases. It first appeared that record or near record high cattle prices might tempt expanding the cattle herd. These same high prices together with estimates of high input costs and a lingering drought in a large part of the South Central U.S. appear to have supported a continued liquidation of the cattle herd. The inventory report was generally market neutral as the industry had anticipated a lower inventory. All cattle and calves in the U.S., as of January 1, 2011, totaled 92.582 million head, down 1.4 percent from an inventory of 93.88 million on January 1, 2010 and about 2.3 million head below the last cycle‘s low of 94.88 million head on January 1, 2004, when the herd re-building began (See Figure 1 and Table1). The size of the U.S. cattle herd is now the lowest since 1958.
Beef Herd Down
While there was a slight increase in most milk cattle categories, there was a decrease in the inventory in all beef categories, except in the inventory of other heifers, (heifers on pastures bound for feedlots). The inventory of beef cows and especially beef cow replacement heifers was down 1.6 percent, and 5.4 percent, respectively (See Table 1). Combined with the large decrease in the inventory of over 500 pound heifers, which are expected to calve this year (down 7.2%), appears to indicate that rate of liquidation increased as ranchers appear to be taking advantage of current high market prices.
The inventory of milk cows at 9.149 million head was up 0.7 percent from an inventory of 9.086 million head on January 1, 2010. The inventory of milk cow replacement heifers and milk heifers expected to calve was up 0.7 percent and up 2.9 percent, respectively.
The inventory of other heifers (heifers on pastures bound for feedlots) increased by 49,400 head on January 1, 2011, indicating that the rate of liquidation may continue as ranchers are waiting for further favorable economic signals and more rain to help determine the future inventory direction.
The National Weather Service suggests a continuation of the dry spell, which began in August 2010, through spring 2011, for the southern tier of the U.S. Furthermore, the weather service estimates that the La Niña weather pattern will influence rainfall amounts in 2011, adding to the probability of drought, for much of the upcoming spring growing season. This lingering dry spell will further discourage herd re-building in a significant portion of the U.S. where cow/calf operations are prevalent.
Prices Up
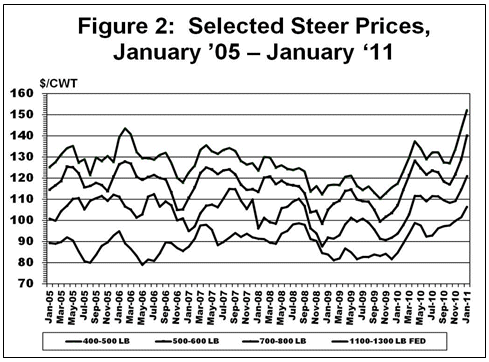
Prices for most cattle categories reached record or near record highs over the past two months after showing weakness during much of 2009 (See Figure 2). Significantly lower cattle supplies and signs of a slowly recovering economy appear to be fueling the market.
Calf Crop Down
The 2010 calf crop was estimated at 35.685 million head, down 0.6 percent from 35.939 million calves born in 2009. According to USDA, this is the smallest calf crop since the 34.9 million born during 1950. Calves born during the first half of 2010 are estimated at 25.9 million, down one percent from 2009.
Feedlots Current
Meanwhile, feedlots appear to be current. According to USDA’s January 21, 2011 Cattle-on-Feed report, cattle and calves on feed for the slaughter market in the U.S. in feedlots with capacity of 1,000 or more head totaled 11.5 million head on January 1, 2011, up 4.6 percent from January 1, 2010 and up 2.5 percent from January 1, 2009.
Cattle placements in feedlots during December 2010, totaled 1.8 million, up 16.0 percent from December 2009. Cattlemen have pulled many cattle off wheat pastures and sent them to feedlots due to the dry weather.
Ample Meat Supplies
According to USDA’s January 21, 2011, Livestock Slaughter report, commercial red meat production for the U.S. totaled 4.36 billion pounds in December 2010, up five percent from the 4.15 billion pounds produced in December 2009. Beef production, at 2.27 billion pounds, was six percent above a year ago. The average live weight at 1,305 pounds was up 9.0 pounds from the previous year.
Meanwhile ample supplies of total red meat and poultry will be produced in 2011. Total beef and pork production in 2011 is projected at 48.2 billion pounds, down just slightly (1.1%) from 48.755 billion pounds produced in 2010. Poultry production is expected to increase by about 0.7 percent. USDA’s projection of total red meat and poultry production for 2011 at about 91.8 billion pounds will be down just slightly (down 0.3%) from about 92.04 billion pounds produced in 2010.
Improved Livestock Production Level
While the January 1, 2011 all-cattle inventory is the lowest since 1958, production efficiency has increased significantly over the years. For example, in 1977 about 24.8 billion pounds of beef and veal were produced with a Jan 1, 1977 cattle inventory of 122.1 million head. This year, about 25.66 billion pounds of beef will be produced from an all-cattle inventory of 92.6 million head, 29.5 million head lower than in1977. In addition, in 1977 about 6.425 billion bushels of corn were harvested from about 70.872 million acres, with an average U.S. yield of 90.7 bushels/acre. According to USDA’s January 12, 2011 supply-demand report, about 12.447 billion bushels of corn were harvested this season from 81.4 million acres of corn with a U.S. average yield of 152.8 bushels/acre.
Appreciation is expressed to Stan Bevers for his contribution and to review this article.


