Vol. 27, Issue 4, February 10, 2011 – PDF version
Jose G. Peña, Texas AgriLife Extension Economist-Management
The U.S. sheep and lamb inventory declined for the 5th year in a row after showing a modest increase for two consecutive years. According to USDA=s January 28, 2011 Sheep and Goats report, the size of the all-sheep and lamb inventory in the U.S. on January 1, 2011, totaled 5.53 million head, down 1.6 percent from January 1, 2010, to the lowest inventory since the peak of 56.2 million head in 1942 (See Figure 1).
The size of the herd in Texas, however, increased six percent to 880,000 head after steady declines since 2006. Record high sheep and lamb prices appear to have attracted some herd re-building. While sheep and lamb prices remain high, the extended drought which began in most of Texas during August ’10, and high energy costs may influence the future direction of herd size in Texas. The National Weather Service suggests a continuation of the dry spell, which began in August 2010, through spring 2011, for the southern tier of the U.S. Furthermore, the weather service estimates that the La Niña weather pattern will influence rainfall amounts in 2011, adding to the probability of drought, for much of the upcoming spring growing season.
Also, while sheep, lamb and wool market currently appears relatively strong, the industry has been plagued with discouraging weak prices for wool, major predation problems and scarce labor pools to harvest the wool during the last few years. These concerns may be encouraging the continuing liquidation of the sheep and lamb herd in most of the U.S.
The size of herd declined in 23 states, increased in 11 states, including Texas, and remained the same in six states. The total U.S. inventory of breeding sheep and lambs at 4.115 million head declined 70,000 head (1.7 percent) from an inventory of 4.185 million a year ago. Ewes one year old and older, at 3.26 million head, were 2.4 percent below last year. Market sheep and lambs totaled 1.415 million head, down 1.4 percent from January 1, 2010. But, the inventory of replacement lambs, which increased in six states, including a large increase in Texas, at 670,000 head, increased 2.3 percent from an inventory of 655,000 head a year ago.
According to USDA’s January 28, 2011 Sheep and Goats report, market lambs comprised 94 percent of the total market inventory. Twenty-seven percent were lambs less than 65 pounds, 12 percent were 65-84 pounds, 21 percent were 85-105 pounds, and 34 percent were over 105 pounds. Market sheep comprised the remaining six percent of total marketings.
Wool Production Down, Value Up
Shorn wool production in the U.S. during 2010 at 30.6 million pounds was down slightly from 30.86 million pounds produced in 2009. Sheep and lambs shorn totaled 4.215 million head, up 20,000 head from 4.195 million head shorn in 2009. The average price paid for wool sold in 2010, at $1.15 per pound was up 36 cents from an average price of $0.79 per pound in 2009 and up 16 cents from $0.99/lb in 2008. While production was down only slightly, with average wool prices up 0.36/lb from a year ago, the total value of wool clip in 2010 increased to $35.288 million, up 45.0 percent from a value of $24.337 million in 2009 and up 1.4 percent from a value of $32.486 million two years ago.
Lamb Prices Up
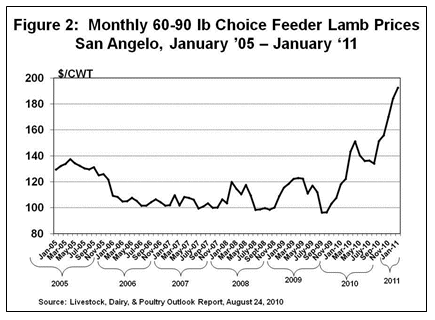
Wool, lamb and mutton (meat from sheep one-year old or older) are the products of the sheep industry. Feeder lamb prices have shown a significant improvement since 2009, reaching record highs recently (see figure 2).
According to Dr. Rick Machen, Professor and Extension Livestock Specialist, up until recently, 60-90 lb lambs were typically sent to either winter grazing or to a feedyard and fed to a target end weight of 120-150 lb. More recently, those same 50-90 lb lambs have been going to slaughter at a steadily increasing pace, primarily as a result of high cost of grain and other input/costs and especially as rising demand for lambs has allowed packers to pay more for these lambs.
Imports
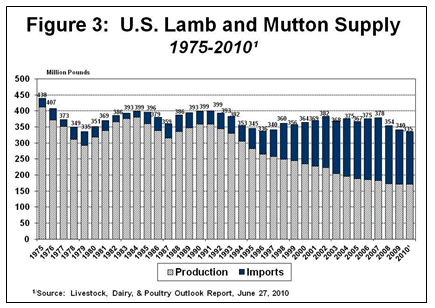
U.S. lamb and mutton supplies dropped slightly during the past three years, but have remained relatively stable for the last 30 years (annual average of about 369 million pounds since 1998), Imports rose rapidly in the mid-1990’s to fill the gap as U.S. lamb production decreased and as lamb imports quickly found consumer acceptance in the U.S. (See Figure 3). Almost all of the U.S. lamb imports come from Australia and New Zealand. Imports account for about one-half of total U.S. domestic lamb and mutton consumption.
Per Capita Consumption
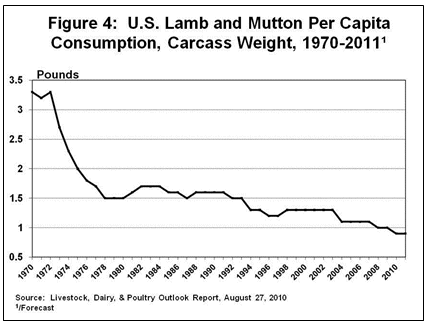
After dropping significantly during the mid-90’s, U.S. Lamb and Mutton per capita consumption appears to be stabilizing at about 0.9-1.0 pound (See Figure 4).
Texas Inventory Up
In Texas, the January 1, 2011 all-sheep and lamb inventory increased to 880,000 head, up 50,000 head (up 6.0%) from an inventory of 830,000 head on January 1, 2010. The Southwest Texas region, where most of the sheep and lambs reside, experienced excellent rain during September ’09 through August 2010, after a severe extended drought during January 2005- August 2009. Improved forage production and record high sheep and lamb prices as well as improved prices of wool probably encourage the herd rebuilding.
The size of the total breeding flock in Texas increased by 40,000 head (up 6.2%), with about 50 percent of the increase coming from a 20,000 head increase (up 19.0%) in replacement lambs. The inventory of breeding ewes in Texas increased 15,000 head (up 2.9%) to 525,000 head on January 1, 2011.
But, even with this increase in the sheep and lamb herd in Texas, the over-all size of the herd in the U.S. and Texas keeps shrinking. The inventory of 6.1 million head on January 1, 1961 in Texas alone was much larger than the size of the total current U.S. inventory. Texas remains the leading state with 15.1 percent of the total U.S. herd, compared to 14.8 percent a year ago.
Appreciation is expressed to Dr. Rick Machen, Professor & Extension Livestock Specialist for his contribution and to review of this article.


