Vol. 26, Issue 7, February 15, 2010 – PDF version
Jose G. Peña, Texas AgriLife Extension Economist-Management
The size of U.S. all-goat inventory decreased for the second year in a row after the inventory high in 2008. All categories of goats, except milk goats which increased by 6.0 percent, decreased in inventory size. The size of the Angora goat herd decreased at the highest rate and has continued to steadily decline since the mid-90’s when the wool and mohair incentive program was terminated.
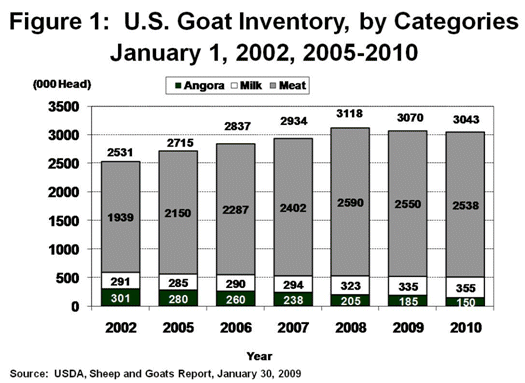
According to USDA’s January 29, 2010 Sheep and Goats report, the all goat inventory in the U.S. on January 1, 2010, totaled 3.043 million head, down 0.8 percent from January 1, 2009. While the inventory of milk goats increased by 6.0 percent to 355,000 head, the inventory of meat and Angora goats decreased by 0.4 percent and 18.9 percent, respectively. (See Figure 1). In January ‘06, it appeared that the liquidation of the U.S. Angora goat herd was slowing down as price bids for Angora kids and mohair improved and were probably influencing the slow-down of the Angora goat herd liquidation. While the southwest Texas region has received excellent rain during the last five months, the extended extreme drought and weak mohair markets, as well as the hardier, more profitable aspect of meat goats has worked against the retention of a large Angora goat herd, especially as the shearing labor force thins.
 The mix between Angora, meat and milk goats has changed dramatically during the last 18 years. Up until the 2008 season, meat goats were replacing Angora goats at a ratio of about 3.5:1 basis. According to USDA’s January 29, 2010, Sheep and Goats report, while the inventory of Angora goats decreased by 35,000 head on January 1, 2010, the inventory of meat goats decreased by only 11,000 head, and the decrease in meat goats was from a much larger inventory of 2.549 million head on January 1, 2009. While the size of the total U.S. goat herd is now over a million head larger than the 1.9 million head U.S. goat herd in 1992, the size of the Angora goat herd has decreased over 90 percent compared to the inventory of meat goats which has increased about 570 percent. Meat goats now comprise about 83 percent of the U.S. goat herd, compared to 1992 when Angora goats accounted for over 90 percent of the total U.S. goat herd.
Mohair Production Down, Prices Weaken
Mohair production dropped to 1.012 million pounds during 2009, down 14.5 percent from 1.184 million pounds produced during 2008, the lowest level since the last high in 1987. After dropping to record lows during the mid-90’s, prices for mohair made an excellent recovery in 2000, weakened during 2002, showed strength during the following five years, but weakened significantly during 2008 and 2009. (See Figure 2).
 Almost all of the mohair is being exported. The industry continues to be supported by exporting the accumulation of stocks stored in warehouses. About one-third more mohair was exported in 2009 than what was produced last year to countries like South Africa (96%), France (3.7%) and Italy (0.4%), with the excess of production coming out of warehouse stocks.
Texas Leading State
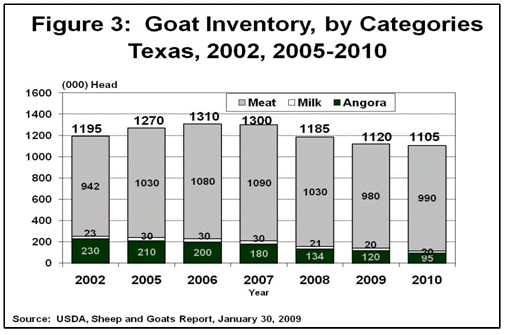
Texas dominates the U.S. commercial goat industry with about 36 percent of the U.S. inventory. (See Figure 3).
 Texas continues to dominate the mohair industry, producing about 66.2 percent of the 1.012 million pounds of mohair produced during 2009, followed by Arizona with 7.9 percent, New Mexico with 7.4 percent, California with 1.7 percent and about 16.8 percent produced in about sixteen other states.
Appreciation is expressed to Dr. Rick Machen for his contribution and to review of this article.
