AG-ECO NEWS
Vol. 24, Issue 26, September 17, 2008 – PDF version
Jose G. Peña
Extension Economist-Management
U.S. Net Farm Income Forecast $10.3 Billion Above Last Year’s Record; Texas May Not Fare As Well; Production Costs Up $40.4 Billion
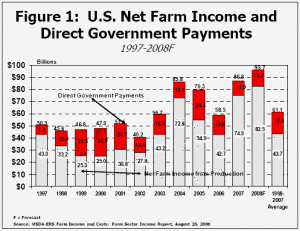
USDA’s September 2008, estimate of U.S. net farm income for 2008 at 95.7 billion is up $3.4 billion from USDA’s initial estimate of $92.3 billion in February 2008 and up $8.9 billion (10.3%) from $86.8 billion in net income in 2007. If realized, net farm income in 2008 will be up $34.6 billion (57%) from a 10-year average of $61.1 billion and top last year’s record (See Figure 1). 
According to USDA-ERS August 28, 2008 Farm Income and Costs report, the boost in 2008 U.S. farm income is primarily the result of high commodity prices. The value of crop production, at a record $188.8 billion, is up 25 percent from last year’s record.
In the livestock sector, prices for cattle and milk are expected to remain well above their average over the last 10 years. Livestock cash receipts are projected to increase about six percent over last year. Higher sales are projected for all livestock sectors, but particularly for broilers, hogs, cattle, and eggs.
Texas
While net U.S. farm income is forecast at a record high primarily as a result of high commodity prices, the drought in a large portion of Texas this year, especially southwest Texas, made it difficult for producers to capture some market opportunities. Also, while a large part of Texas received excellent rains in August, the severe drought across most of Texas which has lasted for over 12 months lead to an estimated $1.4 billion in drought and hurricane (Dolly) losses. According to recent estimates by Dr. Carl Anderson, Professor Emeritus and Dr. David Anderson, Professor and Extension Economist Livestock, crop losses in 2008 are estimated at $1.1 billion. Livestock losses approximated $260 million. Livestock losses included lost hay production, added supplemental feed costs and other production expenditures.
High Grain Prices
While commodity prices have backed off their recent highs, prices are expected to remain strong for the rest of 2008 and into 2009. Higher prices are principally due to strong demand from the domestic biofuels industry and from foreign buyers. As a result, farmers are receiving high prices despite high levels of production. Ethanol production is the single most significant activity affecting agricultural production. U.S. interest in renewable fuels has boomed in the last two years. Corn is the prime beneficiary of the increased production of biofuels, but soybeans are also used. The resulting competition for acreage has also raised prices of edible seeds (peas and beans), potatoes, and processing vegetables as processors and shippers struggle to find reliable supplies of these crops.
Corn production is projected to be the second highest on record. Soybean production is projected to be the fourth highest on record. Consequently, with large harvests to sell at high prices, the outlook for the farm economy as a whole is for another good year in 2008, driven by strong demand for feed crops, oilseeds, and food grains.
Feed costs are a large component of livestock expenses. The exceptionally high prices for feed crops are pinching livestock producers. Rising livestock costs and the continuing drought in the central sector of the U.S. where about 60 percent of the cattle herd reside, have encouraged livestock producers to reduce their herds and cut back on supplement feed use and the use of the less productive areas of their operations. USDA-NASS mid-year Cattle report indicated that the total size of the U.S. cattle herd decreased by 0.5 million head from a year ago.
Production Costs Up 16%
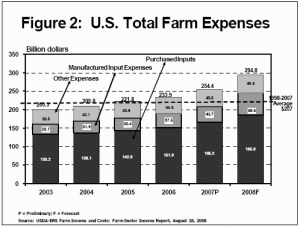
While the rise in commodity prices is boosting gross farm income, USDA-ERS September 2008 forecast report indicates that U.S. production expenses in 2008 are expected to rise $40.4 billion (15.9 percent) in 2008 to a record-high $294.8 billion. If realized, expenses will constitute 76 percent of gross farm income, slightly more than in 2007. The 2008 increase will be the sixth straight since 2002, with total expenses climbing at an increasing rate, heavily influenced by high energy costs (See Figure 2). 
For the third straight year, feed expenses, which heavily impact the livestock sector, are forecast to have the largest increase of any expense item as they rise $9.8 billion (25.6 percent) to a record $47.9 billion. The record increase will top the $6.7-billion increase experienced in 2007. Over the last 3 years, feed expenses have risen $20 billion (71 percent). The primary reason for the rise in 2008 feed expenses is the projected 23-percent increase in prices paid for feed.
Meanwhile, direct government payments are expected to total $13.2 billion in 2008. While the estimate of direct government payments is up from $11.9 billion paid in 2007, payments are 19 percent below a five-year average. This decrease would tend to indicate that the farm sector is carrying more financial risk as cash outlays increase to record highs. Payments under the Direct Payment Program in 2008 are forecast at $5.27 billion, up four percent from 2007. Direct payment rates are fixed in the farm bill and are not affected by the level of program crop prices. Countercyclical payments are expected to decrease from $1.2 billion in 2007 to $957 million in 2008, after a large decrease in 2007. In 2006 and 2007, only upland cotton and peanuts received payments. This is quite a change from previous crop years, when more than half the payments for 2004 and 2005 were to corn.
Consumers Financing Energy Independence
While prices for grains have increased substantially, it appears clear that consumers are sharing the costs of this recent move towards energy independence. According to the U.S. Department of Labor, Bureau of Labor Statistics-Consumer Price Index for August 2008, the Consumer Price Index (CPI) for all-items increased 5.4 percent during the last 12 months, with the index of food and beverages increasing 5.9 percent, transportation up 12.1 percent and energy up 27.2 percent, as retailers pass on higher commodity and energy costs to consumers in the form of higher retail prices.
