AG-ECO NEWS
Vol. 24, Issue 2, January 30, 2008 – PDF version
Jose G. Peña
Texas AgriLife Extension Economist-Management
Corn, Wheat and Cotton Markets Showing Strength, Providing Pricing Opportunities
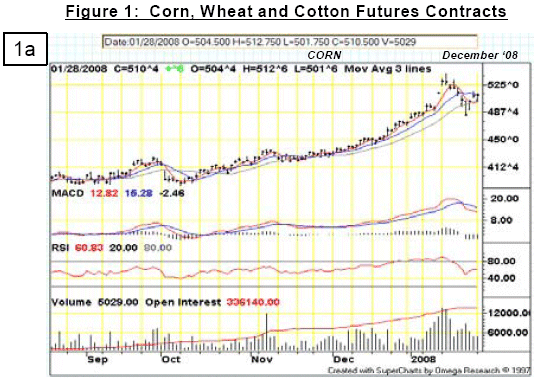
Corn, wheat and cotton markets rallied on Monday (1-28-08), after the recent weakness, and are continuing to provide excellent pricing opportunities as producers start to firm-up planting intentions for 2008. The recent weakness in crude oil prices, weakness in the stock market and a looming recession apparently influenced the recent grain market weakness, but the rebound in crude oil prices and continuing strong export demand for grains is supporting the market rally. December ‘08 corn contracts in the Chicago Board of Trade (CBOT) had weakened to just under $5.00 bu., after reaching contract highs of about $5.26/bu. Near-by, March ‘08, corn futures contracts in the CBOT closed up 3-4 cents to just over $5.00/bu on Monday (1-28-08) and December ‘08 contracts closed to about $5.10/bu. (See Figure 1a) 
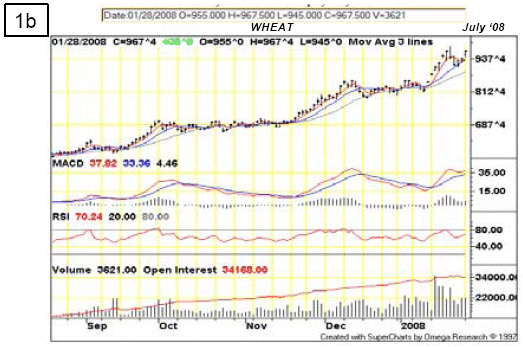
Soybean futures on the Chicago Board of Trade (CBOT) were mixed on Monday with nearby contracts up and distant contracts off, but July ‘08 hard red wheat futures contracts in the Kansas City Board of Trade closed the limit up on Monday at about $9.67/bu. (See Figure 1b) 
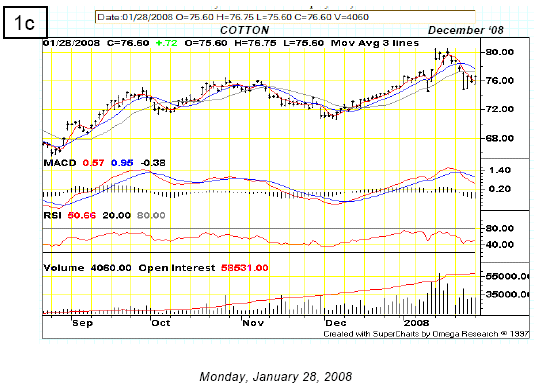
With corn closely tied to ethanol, changes in prices for crude oil, have a significant impact on grain commodity markets. And, while supply/demand fundamentals do not appear to support a major cotton market rally, it appears the recent weakness and improvement in the cotton market is associated with market spill-over from grain markets. December ‘08 futures contracts for cotton on the New York Cotton Exchange (NYCE) dropped 4-5 cents as grain markets weakened, but closed up about a penny on Monday (1-28-08) to about 76.6 cents/lb. (See Figure 1c). 
Corn
USDA’s January 11, 2008 supply/demand report lowered the corn production estimate by 94 million bushels from the December ‘07 estimate, increased the estimate of domestic use by 265 million bushels and lowered the estimate of ending stocks by 359 million bushels. (See Table 1). While ending stocks of 1.438 billion bushels appears adequate for this season, stocks are down twenty percent from last month’s estimate and down 28.1 percent from October ‘07. Once ending stocks drop below 1.5 billion bushels, the market becomes extra sensitive to changes in use and related world/national activities which may influence the market.
With the estimate of exports up 325 million bushels (up 15.3%) from 2.125 billion bushels exported last year, reports of reduced production estimates in competing exporting countries and record high crude oil prices, the corn market shot up. Now, crude oil prices have dropped a bit, improved weather forecasts in South America and worries over recession in the U.S. are causing the market to falter.
Globally, coarse grain supplies for 2007/08 are projected 1.3 million tons lower than the December ‘07 estimate, despite an increase of 1.4 million tons in beginning stocks. World 2007/08 corn production was lowered 2.6 million tons mostly reflecting a reduction in the U.S. Partly offsetting are increases for Argentina sorghum and EU-27 corn, barley, oats, and mixed grains, but reduced global supplies and a weak dollar should support strong export demand and a strong market.
The season-average price received by farmers was projected at $3.70 to $4.30 per bushel, up 35 cents on both ends of the range, based on the sharp rise in both cash and futures prices that has been sustained during recent weeks.
Cotton
The domestic cotton market, which had been sluggish for several years, has improved significantly, apparently influenced by the improvement in grain markets. The outlook for 2008 appears bright as the market competes for planted acres this coming season. With record or near record prices for corn and feed grains there is going to be stiff competition for acreage this season.
The cotton market has been volatile during the last few days. December ‘08 futures prices rose to bump 80 cents a pound by the middle of January ‘08, but dropped about a nickle to about 75 cents this past week. The weakness in the stock market, the potential for a U.S. recession and the continuing crisis in the housing market (cotton has wide use in housing construction) will continue to influence a volatile cotton market.
While the 2007/08 crop appears to carry more market risk, the potential for reduced acreage planted to cotton in 2008 and continuing good export demand would indicate that the outlook for the 2008/09 crop appears good. Current prices for corn, wheat, soybeans and sorghum favors those crops at the expense of potentially reduced acres planted to cotton. Reduced production and relatively strong export demand should support a relatively strong 2008/09 market.
USDA’s January 11, 2008 supply/demand report included marginally higher production, lower exports, and higher ending stocks. Production was raised 46,000 bales to 19.0 million bales. Domestic mill use remained unchanged. Exports were lowered 200,000 bales to 16.0 million, due to sluggish shipments to date and lower imports by China. Accordingly, ending stocks were raised nearly three percent from last month to 7.9 million bales. (See Table 1).
Globally, compared to last month, USDA’s 2007/08 forecasts included lower beginning stocks, production, consumption, trade, and ending stocks. Reduced global ending stocks and potential acreage shifts away from cotton would support a potential for prices to remain relatively strong in relation to the last few seasons.
| Table 1. U.S. Corn and Cotton Supply/Demand | ||||||
| Corn | ||||||
| Item | 2003/04 | 2004/05 | 2005/06 | 2006/07 | 2007/08¹ | %CHNG |
| Planted Acreage | 78.60 | 80.93 | 81.80 | 78.30 | 93.60 | 19.5% |
| Harvested Acreage | 70.94 | 73.63 | 75.10 | 70.60 | 86.50 | 22.5% |
| Yield 2/ | 142.20 | 160.36 | 148.00 | 149.10 | 154.70 | 3.8% |
| Supply | Million Bushels | |||||
| Beginning Stks. | 1,087 | 958 | 2,114 | 1,967 | 1,304 | -33.7% |
| Production | 10,089 | 11,807 | 11,114 | 10,535 | 13,074 | 24.1% |
| Imports | 14 | 11 | 9 | 12 | 15 | 25.0% |
| Total Supply | 11,190 | 12,776 | 13,237 | 12,514 | 14,393 | 15.0% |
| Disappearance | ||||||
| Feed and Residual | 5,795 | 6,158 | 6,155 | 5,598 | 5,950 | 6.3% |
| Food, S eed, & Industrial | 2,537 | 2,686 | 2,981 | 3,488 | 4,555 | 30.6% |
| Total Domestic Use | 8,332 | 8,844 | 9,136 | 9,086 | 10,505 | 15.5% |
| Exports | 1,900 | 1,818 | 2,134 | 2,125 | 2,450 | 15.3% |
| Total Use | 10,232 | 10,662 | 11,270 | 11,211 | 12,955 | 15.6% |
| Unaccounted | ||||||
| Ending Stks. | 958 | 2,114 | 1,967 | 1,304 | 1,438 | 10.3% |
| Ending Stks/Use | 9.36 | 19.83 | 17.45 | 11.63 | 11.10 | -4.6% |
| Average Farm Price | 2.42 | 2.06 | 2.00 | 3.04 | 4.00 | 31.6% |
| Cotton | ||||||
| Item | 2003/04 | 2004/05 | 2005/06 | 2006/07 | 2007/08¹ | %CHNG |
| Planted Acreage | 13.48 | 13.66 | 14.25 | 15.27 | 10.83 | -29.1% |
| Harvested Acreage | 12.00 | 13.05 | 13.80 | 12.73 | 10.5% | -17.60 |
| Yield 2/ | 729.94 | 855.00 | 831.00 | 814.00 | 871.00 | 7.0% |
| Supply | Million Bales | |||||
| Beginning Stks. | 5.39 | 3.45 | 5.50 | 6.05 | 9.48 | 56.7% |
| Production | 18.26 | 23.25 | 23.89 | 21.59 | 19.03 | -11.9% |
| Imports | 0.05 | 0.03 | 0.03 | 0.02 | 0.02 | 0.0% |
| Total Supply | 23.70 | 26.73 | 29.42 | 27.66 | 28.53 | 3.1% |
| Disappearance | ||||||
| Feed and Residual | ||||||
| Food, S eed, & Industrial | ||||||
| Total Domestic Use | 6.27 | 6.67 | 5.87 | 4.95 | 4.60 | -7.1% |
| Exports | 13.76 | 14.44 | 17.55 | 13.01 | 16.00 | 23.0% |
| Total Use | 20.03 | 21.13 | 23.42 | 17.96 | 20.60 | 14.7% |
| Unaccounted | 0.21 | 0.11 | -0.06 | 0.22 | 0.03 | -86.4% |
| Ending Stks. | 3.45 | 5.50 | 6.05 | 9.48 | 7.90 | -16.7% |
| Ending Stks/Use | 17.22 | 26.03 | 25.83 | 52.78 | 38.35 | -27.3% |
| Average Farm Price | 61.80 | 41.60 | 47.70 | 46.50 | 51.50 | 10.8% |
| 1 SOURCE: USDA/NASS/ERS/WASDE January 11, 2008 Supply/Demand Report 2 Bushels for corn; pounds for cotton |
||||||
