AG-ECO NEWS
Vol. 24, Issue 3, February 12, 2008 – PDF version
Jose G. Peña
Texas AgriLife Extension Economist-Management
U.S. Cattle Inventory Down Slightly
Drought, High Feed and Energy Costs End Re-building Cycle
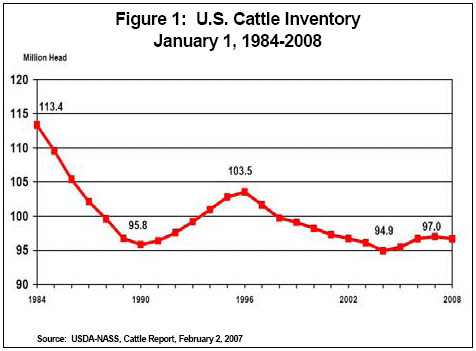
The U.S. cattle inventory decreased slightly after three years of slight inventory increases, apparently ending one of the shortest cycles in recent history. According to USDA’s February 1, 2008 Cattle Report, all cattle and calves in the U.S., as of January 1, 2008, totaled 97.669 million head, down just slightly (0.3%)from 97.0 million on January 1, 2007 to about the same inventory of96.7 million head which were on hand on January 1, 2006. The size of the herd remains about 1.9 percent above the January 1, 2004inventory when the herd re-building cycle began, but 6.6 percent below the 103.7 million head previous cyclical peak on January 1, 1996. (See Figure 1). 
The inventory decline was expected as the continuing drought in a large part of the U.S., downward pressure on the market and high feed/energy costs are causing ranchers to thin their herds.
Beef Herd Down
Most of the inventory decrease was in the beef breeding herd. While the inventory of milk cows, milk replacements heifers and milk heifers expected to calve in 2008 increased by 330,000 head, the inventory of the beef breeding herd, including beef cows, heifers for beef cow replacements and beef heifers expected to calve in 2008, decreased by 693,000 head. (See Table 1). The increase in the dairy herd and the large number of cattle on feed helped balance the inventory change and appear to reduce the impact of the significant decrease in the size of the beef breeding herd.
|
TABLE 1. UNITED STATES ALL CATTLE AND CALVES
NUMBER BY CLASS AND CALF CROP January 2002-2008 |
||||||||
| 2002 | 2003 | 2004 | 2005 | 2006 | 2007 | 2008 | % CHNG 2007/08 |
|
|
x 1,000 Head
|
||||||||
| ALL CATTLE/CALVES | 96,704 | 96,100 | 94,888 | 95,438 | 96,702 | 97,003 | 96,669 | -0.3% |
| COWS/HEIFERS THAT HAVE CALVED | 42,299 | 42,125 | 41,851 | 41,920 | 42,056 | 42,023 | 41,777 | -0.6% |
| BEEF COWS | 33,118 | 32,983 | 32,861 | 32,915 | 32,994 | 32,891 | 32,553 | -1.0% |
| MILK COWS | 9,112 | 9,142 | 8,990 | 9,005 | 9,063 | 9,132 | 9,224 | 1.0% |
| ALL HEIFERS/500 LBS AND OVER | 19,678 | 19,628 | 19,345 | 19,573 | 19,984 | 20,086 | 20,003 | -0.4% |
| BEEF COW REPLACEMENTS | 5,561 | 5,624 | 5,518 | 5,691 | 5,904 | 5,877 | 5,670 | -3.5% |
| EXPECTED TO CALVE ¹ | 3,425 | 3,548 | 3,493 | 3,496 | 2,896 | 2,837 | 2,928 | 3.2% |
| OTHER HEIFERS | 10,057 | 9,891 | 9,806 | 9,763 | 9,805 | 9,899 | 9,876 | -0.2% |
| STEERS/500 LBS AND OVER | 16,790 | 16,554 | 16,277 | 16,476 | 16,933 | 17,222 | 17,305 | 0.5% |
| BULLS/500 LBS AND OVER | 2,244 | 2,248 | 2,206 | 2,219 | 2,263 | 2,215 | 2,207 | -0.4% |
| CALVES UNDER 500 LBS | 15,763 | 15,545 | 15,210 | 15,250 | 15,465 | 15,456 | 15,378 | -0.5% |
| 2001 | 2002 | 2003 | 2004 | 2005 | 2006 | 2007 | ||
| CALF CROP | 38,280 | 38,224 | 37,903 | 37,505 | 37,575 | 37,519 | 37,361 | -0.4% |
| ¹ REPLACEMENT HEIFERS EXPECTED TO CALVE DURING THE YEAR. SOURCE: AGRICULTURAL STATISTICS BOARD: USDA |
||||||||
While the inventory of other heifers (heifers on pastures bound for feedlots) decreased by 23,000 head on January 1, 2007, 5.675 million head of cows were slaughtered during 2007, up 6.4 percent from 5.336 million slaughtered in 2006. This may indicate that ranchers are upgrading to a younger herd, waiting for further production costs/market signals to help determine the future inventory direction.
It appears that the continuing dry weather, record high corn prices (feed costs), high energy costs, a sluggish economy and downward pressure on the market have had a significant impact to trigger the liquidation of the U.S. beef cattle herd. The National Weather Service suggests continuing dry weather in the central U.S. region, which accounts for approximately 60 percent of the U.S. cattle herd and may cause more liquidation.
Prices Down
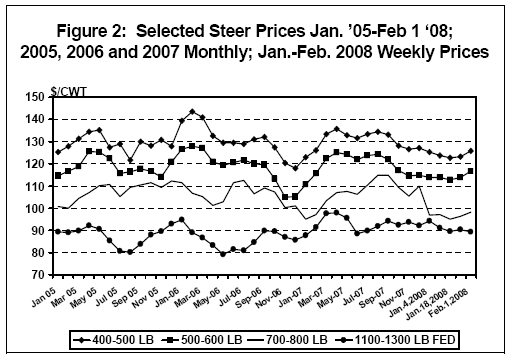
After record high prices for most beef cattle categories during winter ‘06 and ‘07, prices have weakened as input costs, i.e., feed/energy costs increase. (See Figure 2). High feed costs and a sluggish slaughter cattle market are pushing prices down for all cattle categories. And, while the January 1, 2008 cattle inventory was down just slightly, weather and feed costs will be the key determinants of the future direction of the size of the U.S. cattle herd. Grass, hay and feed grains will remain expensive this year. 
Ethanol
The continuing surge in corn demand for ethanol production has and will continue to have a significant widespread impact on U.S. agriculture, especially livestock agriculture as feed costs increase.
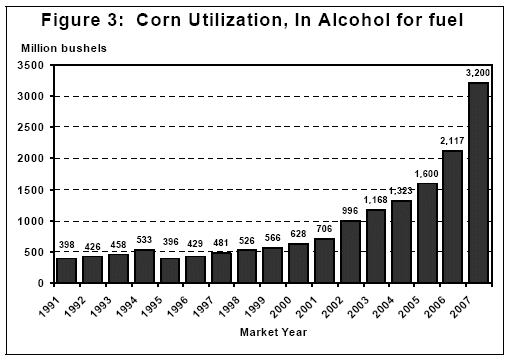
The recent boom in ethanol plant development was influenced by high energy costs and a positive political climate. Corn use for ethanol production has more than doubled since 2002 and is now expected to consume about 3.2 billion bushels of corn, or about 24.5 percent of this season’s entire U.S. record corn crop of 13.074 billion bushels. (See Figure 3). 
Plan for High Feed Costs
Keep in mind that increased demand for corn has resulted in sharply higher prices for corn, not a short crop. Demand driven corn prices will remain high unless corn production (or supplies of adequate substitutes or imports) increases significantly, which is highly unlikely. While higher prices send a market signal for increased corn production, a crop of about 13 billion bushels of corn or more, would be needed to make feed prices more economically manageable. Even with record corn yields in 2008, we would need to plant about the same number of acres as were planted last year to approximate this level of production. Early estimates indicate that about nine million less acres will be planted to corn this season. As a result, cattle producers should plan to contend with high feed costs as compared to the last few years of abundant supplies of corn and relatively inexpensive feed costs.
Calf Crop Down
The 2007 calf crop was estimated at 37.361 million head, down very slightly (0.04 percent) from 37.519 million calves born in 2006. Calves born during the first half of the year (spring 2007 feeder calf crop) were estimated at 27.2 million, down less than one percent from 2006.
Feedlots Full
Meanwhile, feedlots appear full. According to USDA’s January 26, 2008 Cattle-on-Feed report, cattle and calves on feed for the slaughter market in the U.S. in feedlots with capacity of 1,000 or more head totaled 12.1 million head on January 1, 2008, up one percent from January 1, 2007 and the highest January 1 inventory since the series began in 1996. It appears that shortages of winter pastures, as a result of the continuing drought, has caused increased placements of last year’s calf crop.
Cattle placements in feedlots during December ‘07, totaled 1.7 million, down about one-half of one percent from December ‘06 and ten percent below December ‘05.
