Click here for the Acrobat version of this publication.
Vol. 22, Issue 35, November 9, 2006
Jose G. Peña
Extension Economist-Management
Corn Market Improves Significantly, Cotton Remains Weak
Corn Production Forecast Down, Cotton Up
Grain markets are showing a significant improvement since USDA’s October 12, 2006 supply/demand report lowered the estimate of corn acres for harvest by 794,000 and reduced average yield slightly. And, average yield was reduced an additional 2.3 bu/ac in the November 9, 2006 supply/demand report, dropping the production estimate by an additional 16 million bushels. While USDA’s October reduction in the production estimate surprised the industry, the market is being fueled by strong demand (ethanol), tight supplies and expectation that the crop would be cut again in November, which was confirmed in the November 9, 2006 supply/demand report.
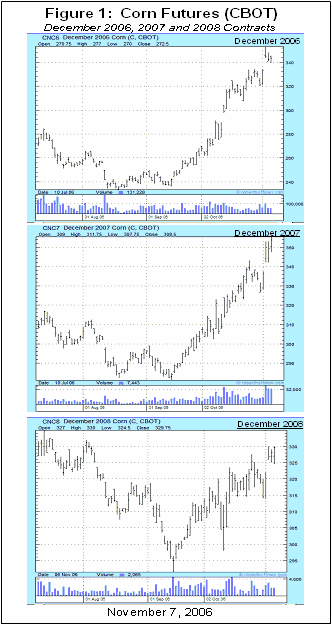
After dropping to life-of-contract lows in mid-August ‘06, price bids for corn futures contracts in the Chicago Board of Trade (CBOT) have rallied sharply. (See Figure 1). This rally is providing pricing opportunities for the ‘07 and ‘08 crop year.  Both cash and futures prices have increased close to $1.00/bushel during the past five weeks. A market price change of over 50% in a relatively short period of time is quite unusual. This recent increase appears especially unusual since prices usually weaken to their lowest levels of the year during the harvest season. In addition, the November ‘06 production estimate of 10.745 billion bushels, if realized, will be the third-largest crop on record.
Corn
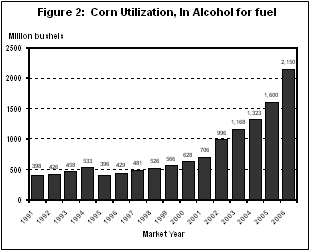
While the industry was surprised by USDA’s October reduced forecast, keep in mind that this steep rally is one of the very few that has not been driven by a crippling disaster. It appears that increased demand and tight supplies are fueling the market. Projected feed and residual use has been lowered by 75 million bushels since the September estimate, but the estimate of use remains at a record 11.79 billion bushels. It appears that this summer’s boom in ethanol plant development, which was influenced by high energy costs, has increased demand for corn. Use for ethanol production has more than doubled since 2002 and is now expected to consume about 2.15 billion bushels of corn, or about 20 percent of this season’s entire U.S. corn crop. (See Figure 2).

Some contend that this increase has caused the demand curve to shift to the right, i.e., higher consumption at a higher price. Economic incentives continue to make investments in ethanol development very profitable. If incentives are discontinued, will ethanol production compete favorably with gasoline to sustain this increased use for ethanol production? And, will this new higher price plateau be sustained if there is an adjustment in other use. Corn forms our food base and used to feed cattle, sheep, poultry, etc., in breakfast cereal, pet food, sweeteners and a multitude of other uses.
Use will exceed production by 1.04 billion bushels, lowering ending stocks to 935 billion bushels, down 52.6 percent from this past season. (See Table 1).
| TABLE 1. U.S. CORN SUPPLY ESTIMATES/1 | |||||||
| U.S. | |||||||
| 2004 | 2004 | 2006/07 | %CHNG | ||||
| September | October | November | Sept./Nov. 2006/07 | Nov. 2005/06 | |||
| Million bushels | |||||||
| BEGINNING STOCKS | 958 | 2,114 | 2,012 | 1,971 | 1,971 | -2.00% | -6.80% |
| PRODUCTION | 11,807 | 11,112 | 11,114 | 10,905 | 10,745 | -3.30% | -3.30% |
| IMPORTS | 11 | 11 | 10 | 10 | 10 | 0.00% | -9.10% |
| TOTAL SUPPLY | 12,776 | 13,237 | 13,136 | 12,886 | 12,726 | -3.10% | -3.90% |
| DOMESTIC USE | 8,844 | 9,117 | 9,665 | 9,640 | 9,590 | -0.80% | 5.20% |
| EXPORTS | 1,818 | 2,147 | 2,250 | 2,250 | 2,200 | -2.20% | 2.50% |
| TOTAL USE | 10,662 | 11,264 | 11,915 | 11,890 | 11,790 | -1.00% | 4.70% |
| ENDING STOCKS | 2,114 | 1,971 | 1,220 | 996 | 935 | -23.40% | -52.60% |
| AVG FARM PRICE² | $2.06 | $2.00 | $2.35 | $2.60 | $3.00 | 27.70% | 50.00% |
| USE-TO-SUPPLY | 83.5% | 85.10% | 90.70% | 92.30% | 92.60% | 2.10% | 8.90% |
| ENDING STOCK-TO-USE | 19.8% | 17.50% | 10.20% | 8.40% | 7.90% | -22.50% | -54.70% |
| ¹ SOURCE: USDA/NASS/ERS/WASDE November 9, 2006 Supply/Demand Report ² Corn in bushels |
|||||||
USDA’s November ‘06 projected price range for corn was up 40 cents on both ends to $2.80-$3.20 per bushel, compared with September’s estimate.
Cotton
USDA’s November 9, 2006 supply/demand report for the U.S. indicated increased production, slightly higher use and higher ending stocks compared to last month. The cotton market remains stagnant. December ‘06 futures prices dropped to life-of-contract lows shortly after USDA’s October 12, 2006 supply/demand report was released and have shown only a slight improvement since then.
Beginning stocks were raised 100,000 bales in October and production has increased 950,000 bales since the September estimate. Domestic mill use has been reduced 300,000 bales since September, but exports were increased by 200,000 bales in November. Sluggish export demand, however, is having a serious impact on the market as the production estimate increases. Ending stocks at 6 million bales are up 600,000 bales from last month’s estimate, but slightly below the 2005/06 season. (See Table 2).
With U.S. cotton exports accounting for 76 percent of production, the world cotton situation is keeping a heavy lid on the U.S. cotton market. Globally, beginning stocks, production, trade, and ending stocks were lowered compared with last month, but with the estimate of ending stocks at 51.05 million bales, ample supplies are available to keep a lid on the market.
| TABLE 2. U.S. COTTON SUPPLY ESTIMATES/1 | |||||||
| U.S. | |||||||
| 2004 | 2004 | 2006/07 | %CHNG | ||||
| September | October | November | Sept./Nov. 2006/07 | Nov. 2005/06 | |||
| Million bales | |||||||
| BEGINNING STOCKS | 3.45 | 5.50 | 5.95 | 6.05 | 6.05 | 1.7% | 10.0% |
| PRODUCTION | 23.25 | 23.89 | 20.35 | 20.66 | 21.30 | 4.7% | -10.8% |
| IMPORTS | 0.03 | 0.03 | 0.03 | 0.03 | 0.03 | 0.0% | 0.0% |
| TOTAL SUPPLY | 26.73 | 29.42 | 26.33 | 26.74 | 27.38 | 4.0% | -6.9% |
| DOMESTIC USE | 6.69 | 5.89 | 5.50 | 5.30 | 5.20 | -5.5% | -11.7% |
| EXPORTS | 14.44 | 18.04 | 16.20 | 16.00 | 16.20 | 0.0% | -10.2% |
| TOTAL USE | 21.13 | 23.93 | 21.70 | 21.30 | 21.40 | -1.4% | -10.6% |
| ENDING STOCKS | 5.50 | 6.05 | 4.60 | 5.40 | 6.00 | 30.4% | -0.8% |
| AVG FARM PRICE² | $0.416 | $0.477 | $0.459 | -3.8% | |||
| USE-TO-SUPPLY | 79.0% | 81.3% | 82.4% | 79.7% | 78.2% | -5.2% | -3.9% |
| ENDING STOCK-TO-USE | 26.0% | 25.3% | 21.2% | 25.4% | 28.0% | 32.3% | 10.9% |
| ¹ SOURCE: USDA/NASS/ERS/WASDE November 9, 2006 Supply/Demand Report ² $/Lb for August 2006 |
|||||||
