AG-ECO NEWS
Vol. 22, Issue 08, March 29, 2006
Jose G. Peña
Extension Economist-Management
Corn, Cotton and Soybean Markets Weakened But Regained Some Strength
Dry Conditions, High Energy Costs and Stocks Build-up Influencing Markets
After showing some strength during February-early March, as the drought intensified and could delay plantings, corn, cotton and soybean market weakened. The weakening was probably influenced by recent rains, high energy costs and continued indications of large carry-over stocks. Markets took a slight up-turn, this past week and appeared to be showing signs of strength.
While recent rain had some short term market influence, the continuing drought, high energy costs, and their effect on planting intentions, appear to be contributing to the mixed market signals. High energy costs could cause reduced corn and increased soybean plantings.
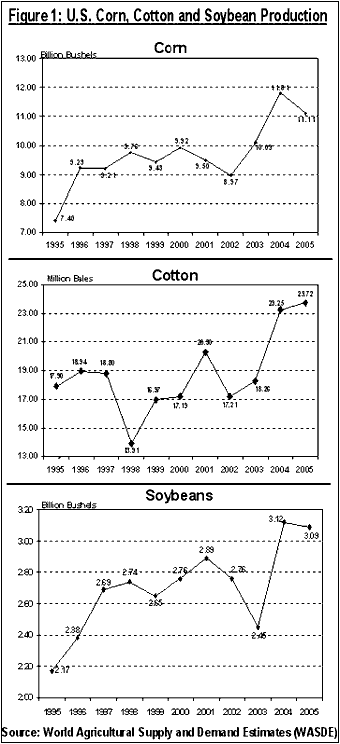
Futures price bids showed some strengths during February-early-March, after weakening since USDA’s September 12, 2005 forecast of the 2005/06 corn, cotton and soybean crops as the second largest on record. Cotton production was subsequently adjusted to the largest crop on record. (See Figure 1). While use estimates have increased, two years of record high production has caused stocks to gradually build-up and weaken markets. USDA’s March 10, 2006 supply/demand report shows an 11.2%, 7.6% and 120.7% increase in 2005/06 season’s ending stocks of corn, cotton and soybean, respectively, over the 2004/05 season. 
While prices for almost everything have increased recently, markets for most agricultural commodities have remained weak. And, while increased input costs will increase costs of production, the recent acceleration of inflation should help improve prices for agricultural commodities. The recent increase in food prices may boost prices for agricultural commodities.
Dry Weather Forecast
While some recent rain has been recorded, future weather reports and USDA’s planting intentions report, due out on March 31, 2006, should have a relatively strong influence on the market.
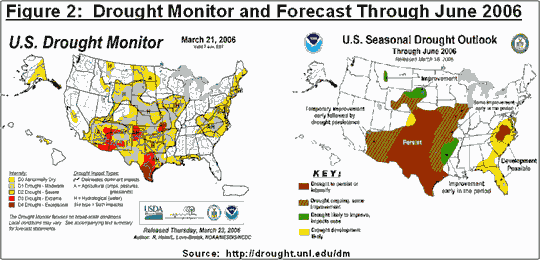
The recent cold spell brought some snow and rain to portions of Texas and the U.S. corn belt, but much more rain will be needed to sustain drought recovery. Light to moderate precipitation continued to boost soil moisture levels across the corn belt, but largely missed the Panhandle area of Texas and parts of Oklahoma. So, while recent rains made a slight improvement to moisture conditions in the corn belt, conditions remain very dry in the most productive Central U.S. region. USDA’s most recent seasonal drought outlook through June ‘06 only shows a very slight improvement in parts of the U.S. corn belt. (See Figure 2). Markets will remain weather driven. While a third year of large crops appears unlikely, large carry-over stocks appear to be holding major market rallies in-check. 
| Table 1. Corn U.S. Supply/Demand | |||||||||
| Item | 98/99 | 99/00 | 00/01 | 01/02 | 02/03 | 03/04 | 04/05 | 05/06 | 06/07* |
| Planted Acreage (Mil. Acs.) | 80.17 | 77.39 | 79.60 | 75.80 | 78.90 | 78.60 | 80.93 | 81.76 | 80.50 |
|---|---|---|---|---|---|---|---|---|---|
| Harvested Acreage (Mil. Acs.) | 72.59 | 70.49 | 72.44 | 68.77 | 69.32 | 70.94 | 73.63 | 75.11 | 73.0 |
| Yield (Bushels) | 134.40 | 133.80 | 136.90 | 138.20 | 129.30 | 142.20 | 160.36 | 147.90 | 147.70 |
| Supply: | Million Bushels | ||||||||
| Beginning Stocks | 1,308 | 1,787 | 1,718 | 1,899 | 1,596 | 1,087 | 958 | 2,114 | 2,401 |
| Production | 9,759 | 9,431 | 9,915 | 9,503 | 8,967 | 10,089 | 11,807 | 11,112 | 10,810 |
| Imports | 19 | 15 | 7 | 10 | 14 | 14 | 11 | 10 | 10 |
| Total Supply | 11,085 | 11,232 | 11,640 | 11,412 | 10,578 | 11,190 | 12,776 | 13,236 | 13,221 |
| Disappearance: | |||||||||
| Feed and Residual | 5,472 | 5,664 | 5,842 | 5,868 | 5,563 | 5,795 | 6,162 | 6,000 | 5,950 |
| Food, Seed & Industrial | 1,826 | 1,913 | 1,957 | 2,046 | 2,340 | 2,537 | 2,686 | 2,985 | 3,545 |
| Exports | 1,984 | 1,937 | 1,941 | 1,905 | 1,588 | 1,900 | 1,814 | ,1900 | 2,000 |
| Total Use | 9282 | 9514 | 9740 | 9819 | 9491 | 10232 | 10662 | 10885 | 11495 |
| Ending Stocks | 1787 | 1718 | 1899 | 1596 | 1087 | 958 | 2114 | 2351 | 1726 |
| Carryover/Use (%) | 19.25 | 18.06 | 19.50 | 16.25 | 11345 | 9.36 | 19.83 | 21.60 | 15.02 |
| Average Farm Price ($/Bu.) | 1.94 | 1.82 | 1.85 | 1.97 | 2.32 | 2.42 | 2.03 | 1.95 | 2.15 |
| * 2004/05 estimated; 2005/06 projected; numbers may not add due to rounding; 06/07 projection from 2006 Agricultural Outlook Forum, Interagency Commodity Estimates Committee, USDA. Source: USDA/NASS/ERS/WASDE | |||||||||
Cotton
While production and domestic mill use remained unchanged, USDA March 10, 2006 Supply/Demand increased the estimate of exports and lowered ending stocks relative to last month. Exports were raised 400,000 bales based on a forecast of higher imports demand by China.
While the estimates of ending stocks at 6.6 million bales was 5.7 percent lower than last month’s estimate of 7.0 million bales, ending stocks are up 19.1 percent from last season’s ending stocks of 5.54 million bales. This will keep a lid on a major market rally for the old crop.
Dr. Carl Anderson, Professor and Extension Specialist-Emeritus, estimates that new crop acres for harvest will decrease by close to 70,000 acres. The dry spell and other factors may reduce average yields by about 80 pounds per acre. This would mean that new crop production could drop to about 20.48 million bales, down 3.24 million bales (13.7 percent) from USDA’s current 2005/06 season’s production estimate of 23.72 million bales. While use could be slightly lower, reduced production could reduce stocks to a more manageable 5.21 million bales. (See Table 2). The new crop markets should improve.
| Table 2. Cotton U.S. Supply/Demand | |||||
| Item | 02/03 | 03/04 | 04/05 | 05/06 | 06/07* |
| Planted Acreage (Mil. Acs.) | 13.96 | 13.48 | 13.66 | 14.20 | 14.40 |
|---|---|---|---|---|---|
| Harvested Acreage (Mil. Acs.) | 12.42 | 12.00 | 13.03 | 13.70 | 13.01 |
| Yield (lbs/ac) | 666.00 | 730.00 | 855.00 | 831.00 | 750.00 |
| Supply: | – – – – – – – – – – – – – – – Million Bales – – – – – – – – – – – – – – – | ||||
| Beginning Stocks | 7.45 | 5.39 | 3.51 | 5.54 | 6.60 |
| Production | 17.21 | 18.26 | 23.25 | 23.72 | 20.48 |
| Imports | 0.07 | 0.05 | 0.03 | 0.03 | 0.03 |
| Total Supply | 24.73 | 23.70 | 26.76 | 29.29 | 27.11 |
| Disappearance: | |||||
| Mill Use | 7.27 | 6.22 | 6.69 | 5.90 | 5.80 |
| Exports | 11.90 | 13.76 | 14.41 | 16.80 | 16.50 |
| Total Use | 19.17 | 19.98 | 21.10 | 22.70 | 22.30 |
| Unaccounted | 0.17 | 0.20 | 0.15 | -0.01 | 0.00 |
| Ending Stocks | 5.39 | 3.51 | 5.54 | 6.60 | 5.21 |
| Ending Stocks/Use | 28.12 | 17.57 | 26.26 | 29.07 | 23.36 |
| “A” Index | — | — | — | — | — |
| Average Farm Price ($/Bu.) | 44.50 | 61.80 | 41.60 | **47.30 | ?? |
| * Source: World Ag Supply/Demand Estimates, USDA, 3/10/06; Cotton: World Market and Trade Yearbook, 11/05; 2004/05 estimated; 2005/06 projected** Average price for August – January 2006 | |||||
Appreciation is expressed to Drs. Carl Anderson and Jackie Smith for their contribution to and review of this article.
