AG-ECO NEWS
Vol. 22, Issue 04, February 28, 2006
Jose G. Peña
Extension Economist-Management
The U.S. Sheep Inventory up Slightly for the 2nd Year in a Row;
Texas Up 2% Lamb Market Attractive; Wool Market Weak
The size of the U.S. sheep and lamb flock increased slightly for the 2nd year in a row after eleven years of steady declines. The size of the herd dropped to 6.1 million head in 2004, the lowest inventory since 1942 when the size of the herd reached a peak of 56.2 million head. While the January ‘06 inventory showed a 95,000 head increase over last year, the size of the herd remains 1.4 percent below the 6.321 million head in 2003. In addition, the herd increased for the 2nd consecutive year in spite of a devastating dry spell during the past 10 months and appears to indicate that the herd size may be stabilizing. While wool prices remain weak and lamb prices weakened recently after last year’s record highs, the herd increase may mean that economic factors between lamb and wool production and consumption may be coming into balance.
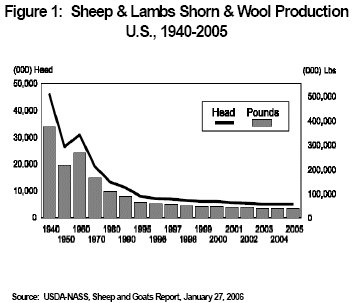
According to USDA, the all sheep and lamb inventory in the U.S. on January 1, 2006 totaled 6.23 million head, up 1.5 percent from an inventory of 6.135 million head a year ago and up 2.0 percent from the record low inventory of 6.105 million head on January 1, 2004. Wool production during 2005 at 37.232 million pounds was 1.0 below 37.627 million pounds produced in 2004 and 2.8 percent below 38.299 million pounds in 2003. (See Figure 1).
The size of the total U.S. breeding herd at 4.639 million head was up 2.3 percent from an inventory of 4.534 million head a year ago and up 3.1 percent from a breeding herd of 4.5 million head on January 1, 2004. While the size of herd declined in only eleven states, 39 states showed a herd increase or no change to their herd size. 
In Texas, which accounts for 17.5 percent of the U.S. herd, the January 1, 2006 inventory increased slightly to 1.09 million head, up 1.9 percent from an inventory of 1.07 on January 1, 2005 and up 4.8 percent from the record low inventory of 1.04 million on January 1, 2003.
In Texas, while the inventory of breeding ewes, one year and older increased by 40,000 head (up 6.2%) and the total breeding sheep and lamb inventory increased by 30,000 head to 870,000 head on January 1, 2006, compared to a year ago, the inventory of replacement lambs dropped 10,000 head (down 6.9%) to 135,000 head. The herd in Texas had been steadily declining since the most recent inventory peak of 6.1 million head on January 1, 1961 when the inventory in Texas alone was significantly larger than the total current U.S. inventory. Texas remains the leading state with 17.5 percent of the total U.S. herd, compared to 17.4 percent a year ago and 18.0 percent in 2004.
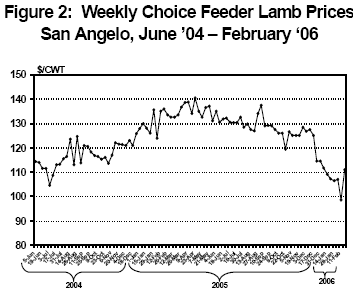
While domestic wool trading continues very slow and feeder lamb trading has slowed down significantly in most areas, except for old crop lambs in the Imperial Valley of CA, choice feeder lamb prices reached record highs last year and remain relatively attractive even with the typical mid-winter market weakness. (See Figure 2). Wool, lamb and mutton (meat from sheep one-year old or older) are the products of the sheep industry. While relatively attractive wool prices and the incentive program sustained the industry until the mid-90’s, the collapse of the wool market and the termination of the incentive program was detrimental to the industry. The recent improvement in lamb and wool prices as well as the recently re-established loan deficiency payment and the ewe lamb retention program should help stabilize the industry.
Imports
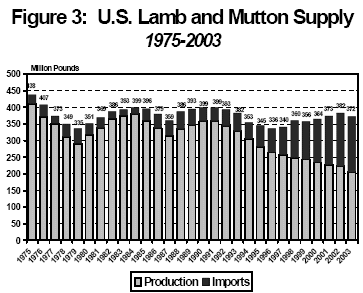
Lamb markets have been showing a steady improvement since 1999. Prices weakened for almost a year after the 9-11 disaster, probably influenced by a weakened economy as well as increased supplies as a result of increased imports from Australia and New Zealand. Almost all of the U.S. lamb imports come from Australia and New Zealand. The recent strengthening of the U.S. dollar in terms of currency exchange rates may make imports less expensive to U.S. consumers and in addition to typical mid-winter market weakness may have had an influence on domestic prices. While U.S. lamb and mutton supplies have remained at a relatively steady annual average of about 368 million pounds since 1998, imports rose rapidly in the mid-1990’s as these lamb imports quickly found consumer acceptance in the U.S. (See Figure 3) Imports account for close to half of domestic lamb and mutton consumption.

Per Capita Consumption
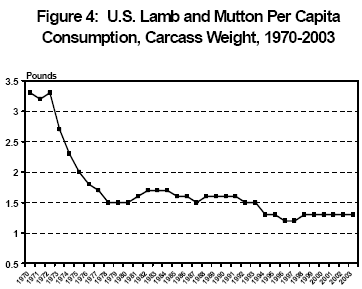
After dropping significantly to record lows in the mid-90’s, it appears that U.S. Lamb and Mutton per capita consumption has stabilized at about 1.3 pounds. (See Figure 4).
Exports
The U.S. exports small quantities of lamb compared to its imports and exports have increased during recent years, but the balance of trade weighs heavily on imports. In 2003, the U.S. exported about 6.6 million pounds of lamb, compared to about 167.6 million pounds which were imported that same year. Most of the U.S. mutton is exported to Mexico. Another key trading location for exports is Canada.
Profitability
While the market for most classes of lambs remains relatively attractive and price bids for wool were showing improvement, lamb and wool production enterprises remain marginally profitable. Recent rains, abundant supplies of forage and a relatively bright U.S. economic outlook will help the industry. The new wool and mohair provisions in the farm bill appear to be helping to provide some financial stability to the industry.

