
James W. Richardson, Professor and TAES Faculty Fellow
and
Joe L. Outlaw, Associate Professor and Extension Economist
Agricultural and Food Policy Center
Texas A&M University
National Extension Training for 2002 Farm Bill
Background for BYA
- AFPC worked with House and Senate Ag Committees on the 2002 Farm Bill
- Analyzed many options for safety net program
- Analyzed options for base and yield updating
- In January we developed an Excel BYA as a stochastic simulation model, but we abandoned it because
- Excel version was too slow
- Texas extension agents do not use Excel
- Re-wrote BYA in Fortran for speed and web delivery
Development of BYA
- Realized early on the Web was the only practical delivery method
- Web based front-end and back-end around a Fortran simulation model offered numerous benefits:
- Utilized our experience in analyzing risk
- Guarantees everyone uses the same model
- We could post updated versions as the FSR Rules changed
- We recognize that there are a large number of decision aids that have been developed
- Our version is the only web based decision aid that offers the ability to analyze options under risk
After We had a Working BYA
- Texas State office suggested contacting Diane Sharp
- Met with FSA D.C. leadership in April
- Looking for help checking our software and implementation specifics
- Began cross-checking with Brad Karmen
- Many iterations later – in a win-win situation
- FSA found that it is working with a group that won’t quit until it is right
- AFPC is assured the software will actually be used
- Common goal is to help producers make more informed decisions on base and yield options
Overview and General Description of BYA
- Designed to be easy to use and understand
- Producers should be able to easily enter data provided by their county office
- Simulates 6 years, 2002-2007, for 500 combinations of prices using FAPRI July 2002 Baseline for price risk
- Producer may enter their own price assumptions for a No Risk (Constant Price) Analysis
- Summarizes results of risk analysis and constant price scenario
- Presents results with a probability ranking and graphs the possible range of government payments
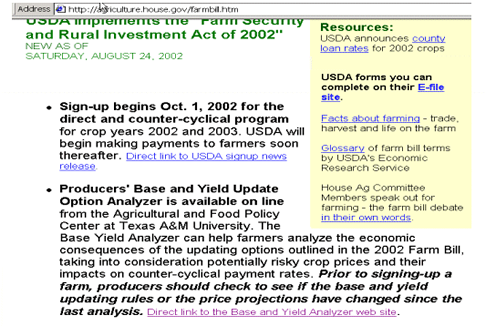
Link to BYA from House Ag. Committee Web Page
http://agriculture.house.gov/farmbill.htm
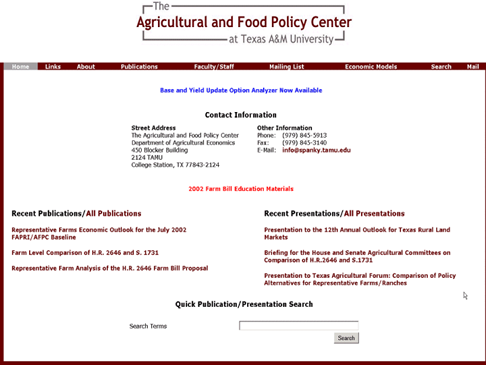
Link to BYA from Texas Extension Site
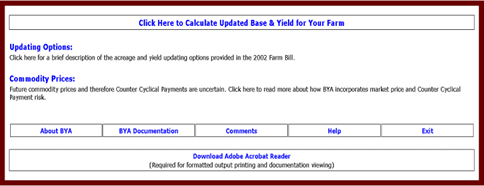
First Page of the BYA
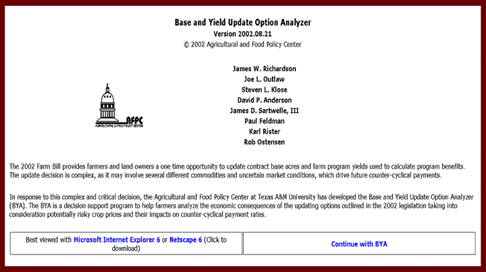
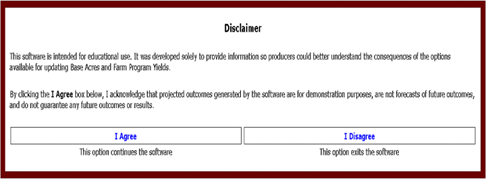
Disclaimer Page
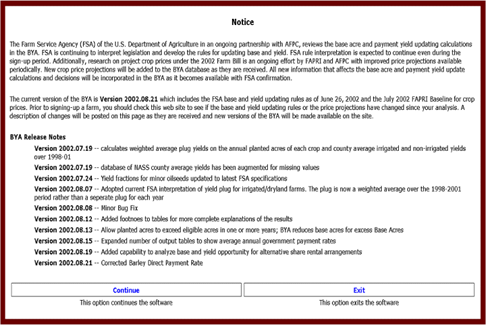
BYA Version Notification
Options for the BYA
- Webster County Iowa farm unit named The Smith Farm 160 acres of cropland
- Two crops grown 1998-2002
- Historical base for three crops
- Production and Farm Program History
CropPlantedBase (PFC)Payment YieldCorn8080100Soybeans8000Oats01550Wheat01540
Input: User Must First Select the State
- Scrollable menu allows user to select the state where the farm resides
- Iowa was selected here for the example

Input: User Must Then Select the County
- Scrollable menu of all county names in each state allows the user to specify the county where farm is located
- State and county are necessary for BYA to pull NASS county yields and the Similar farm’s payment yield from the county data base

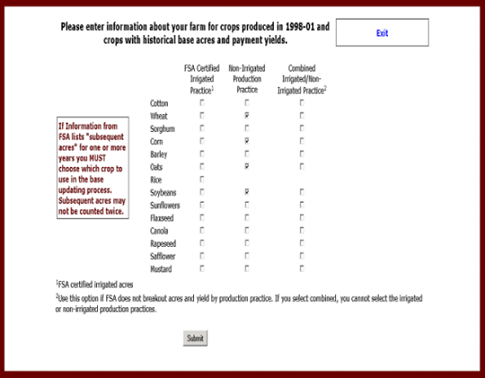
Input: Specify All Covered Crops Produced on the Farm
- User specifies crops based on production practice:
- Irrigated
- Non-Irrigated
- Combined irrigated and non-irrigated
- Must include crops with base acres and crops produced in 1998-2001
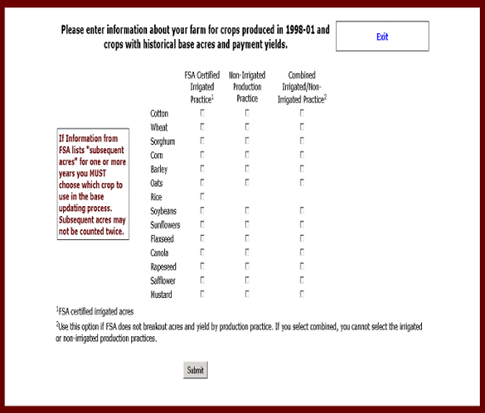
Crop Input: Selected Four Crops for the Example Farm Unit
- Four crops produced on the farm unit:
- Corn
- Soybeans
- Two crops have historical base acres
- Oats
- Wheat
- Combined is used when crop is grown under both irrigated and non-irrigated conditions
Crop Input Screen: User Enters History for Each Crop on the Farm Unit
- Example shows State:IA County:Webster and first crop is wheat
- Enter total cropland on farm and acres in CRP and WRP
- Note: County average yields are inserted by BYA from State/County names
- The Similar Farm’s Payment comes from an FSA database.
- The County Average Yield comes from a NASS database.
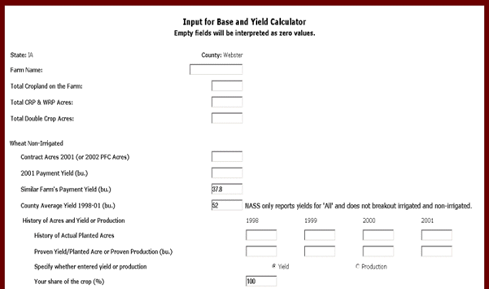
Crop Input Screen: Enter a Name for the Farm Unit and Acres
- Enter the name of the farm unit. Name appears in the report and on summary results tables.
- Total cropland acres minus WRP and CRP acres plus double crop acres defines total eligible acres used to update base acres.

Crop Input Screen: BYA accesses Database for County Average Yields
- Wheat has a historical base but was not planted 1998-2002. Enter the base acres and zero planted acres
- Provide the historical payment yield
- County yield values come from NASS if they are available
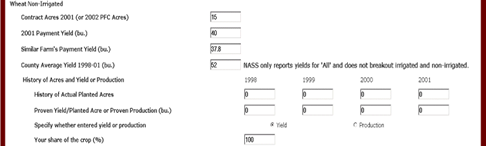
Crop Input Screen: BYA accesses Database for County Average Yields
- County yield values come from NASS if they are available
- Enter actual planted acres and proven yield (or production) for the crop
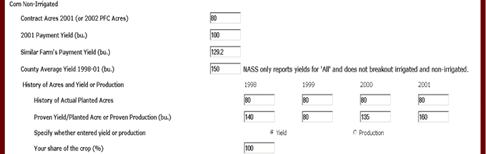
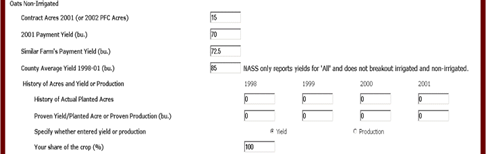
Crop Input Screen: Entered Historical Acres and Yield for a Program Crop
- Enter historical base acres even if the crop was not planted 1998-02
- Enter the historical payment yield as well, even if the crop was not planted
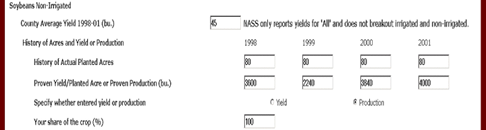
Crop Input Screen: Example for Oilseed Crops — Note Entered Production
- Less input is required because oilseed crops have no historical base acres and payment yield
- NASS county average yield is provided if it is available
- User can type in their own county average yield if FSA’s value is in error
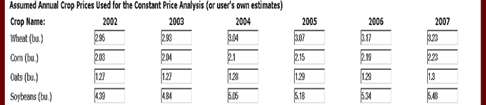
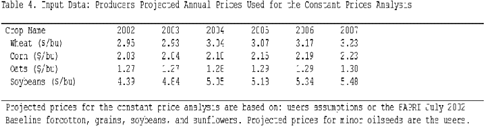
Crop Input Screen: User May Review, Revise or Accept Default Annual Prices
- Producers prices used for the constant price analysis of the alternative base and payment yields
- Users can specify their own annual prices for use in calculating government payments by typing their own values into the cells
- The default prices come from the July 2002 FAPRI Baseline assuming continuation of the 2002 Farm Bill
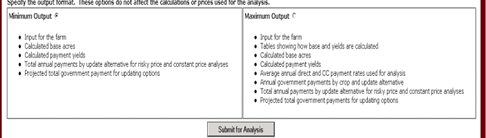
Crop Input Screen: Last Option is the Select the Output Format for Report
- Two reports are generated by BYA.
- Minimum provides the basic tables plus footnotes
- Maximum provides all tables and all footnotes
- Click on Submit for Analysis to simulate the farm unit for 500 iterations of 6 years
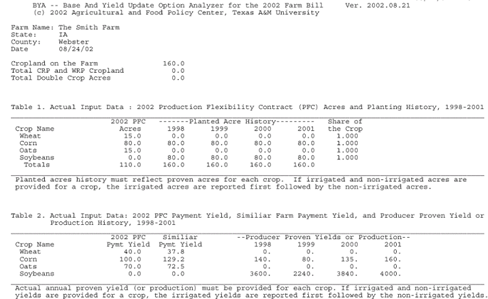
Report: Starts with Users Input Data and Continues with Calculations and Results
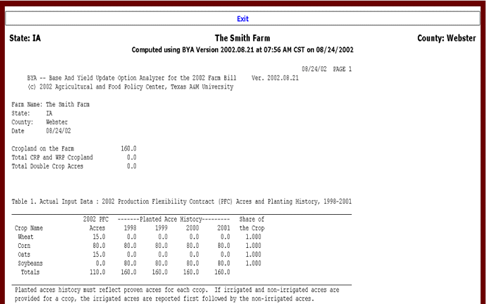
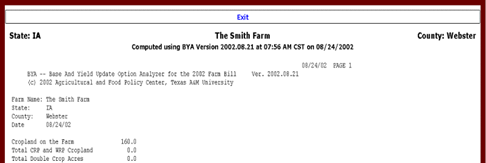
Report: Farm Name, Acreage and Version Number with a Date
- Farm unit’s name, state and count at the outset presented first
- Total cropland on the farm unit is also provided
- BYA version number is important as FSA is changing the rules as we go; unannounced versions will appear
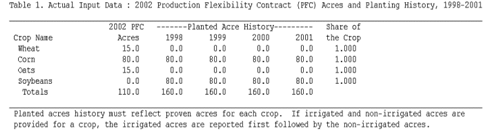
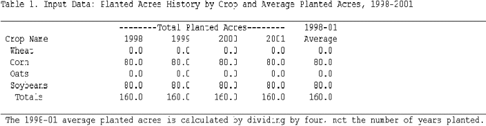
Report: Historical Acreage Input Summary
- Input data provided by the user is summarized in the Report so the user can verify the data was entered properly
- Historical planted acres and current 2002 base acres are summarized in the first input data table
- Share of the crop is provided in this table
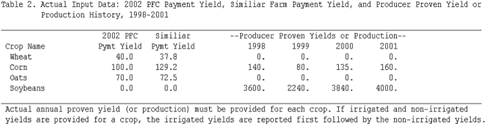
Report: Proven Production, County Yields, and Similar Farm Payment Yield
- Farm unit’s historical production or yield per harvested acre is summarized along with the payment yield on similar farms
- Similar farm’s payment yield is presently based on county average payment yields from FSA
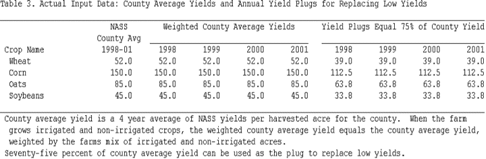
Report: Weighted Average County Yields with Plugs for Low Yields
- NASS county average yield is used to calculate weighted average yield plugs to replace low yields
- Farms with both irrigated and non-irrigated yields have annual weighted average plugs based on the ratio of irrigated and non-irrigated acres each year
Report: Prices for A Constant Price Scenario
- Producer’s prices used to simulate annual counter cyclical prices and government payments for the Constant Price Scenario
- Default prices over ridden by the user will appear in this table
Report: Historical Acreage Used to Calculate Base Acres
- Acres used to calculate base acres are summarized
- For farms with irrigated and non-irrigated acres, this table shows the sum of planted acres across production practices
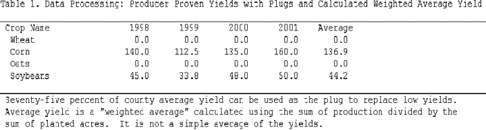
Report: Proven Yields with Plugs Inserted
- Proven yields with adjustments for low yields are summarized in this table
- Average yield is a weighted average of the years the crop was produced. Weighted average is calculated using planted acres each year.
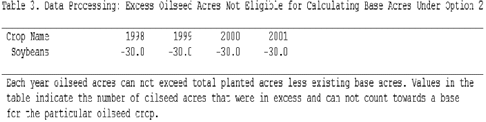
Report: Excess Oilseed Acres
- Oilseed eligible acres can not exceed the difference between total planted acres and total base acres
- In the example planted acres equals 160 and base acres was 110; the difference of 50 is eligible oilseed acres. Given there were on average 80 soybean planted acres, then 30 acres are in excess.
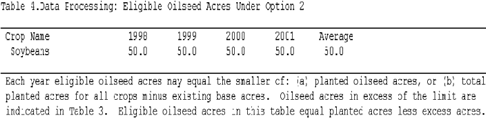
Report: Eligible Oilseed Acres
- Eligible acres for each oilseed crop are summarized in this table
- Eligible oilseed acres equals acres planted minus excess acres in the previous table
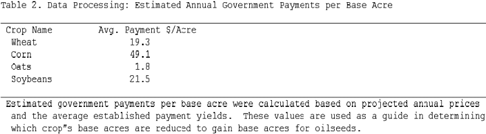
Report: Estimated Annual Government Payment/Acre by Crop
- Estimated per acre government payments are calculated based on an average of the 2002-2007 period CCP rates and direct payment rates and payment yields
- Only calculated if the crop has been grown 1998-02
- These values used when determining which base acres to trade for oilseed base when trying to maximize oilseed base acres
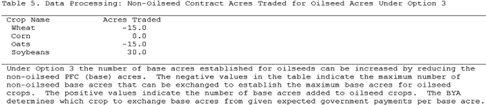
Report: Non-Oilseed Base can Be Traded to Maximize Oilseed Base Acres
- Under the “maximize oilseed” base acre update option, producers can reduce non-oilseed base acres to increase oilseed base acres 1:1
- The acres of base reduced to increase oilseed base are indicated in this table
- Base acres are reduced if expected payments are less than for the oilseed crop
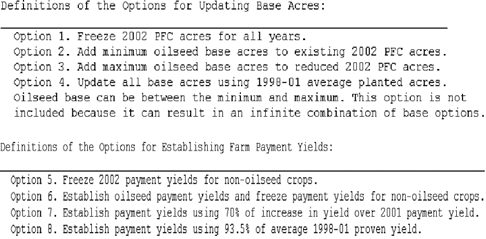
Report: Definition of Base Update and Yield Establishment Options
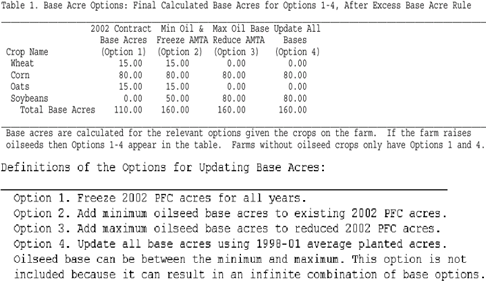
Report: Calculated Base Acres for Permitted Options
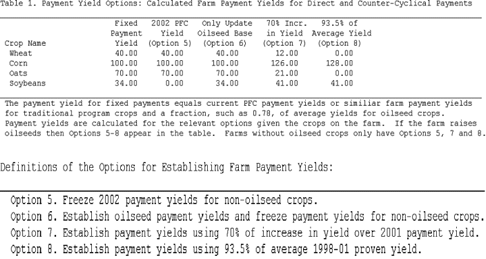
Report: Established Payment Yields
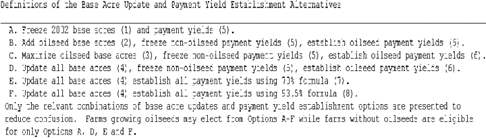
Report: Definition of Permitted Combinations of Base and Yield Updates
- The permitted combinations of Base updating and Payment Yield establishment are named Alternatives A-F
- Remember Options:
- 1-4 are for Base Acres Updating options
- 5-8 are for Payment Yield Establishment options
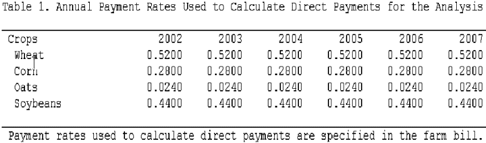
Report: Annual Direct Payment Rates
- Annual direct payment rates are provided as a check
- Annual rates appear in this table for each crop on the farm unit
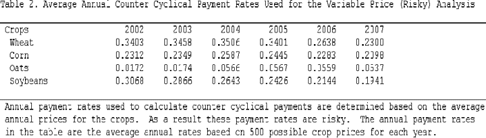
Report: Average Annual CC Payment Rates for Risk Prices
- Average annual CC payment rates are calculated from the 500 draws of crop prices each year
- These CC payment rates will not equal the rates for the constant price scenario
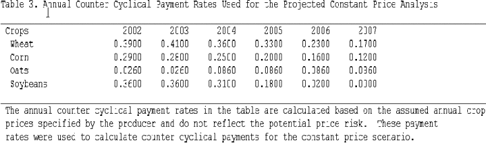
Report: Annual CC Payment Rates for Constant Price Scenario
- Constant prices provided by the user are used to calculate the CC payment rates in this table
- These CC payment rates are used to calculate CC payments for the constant price scenario
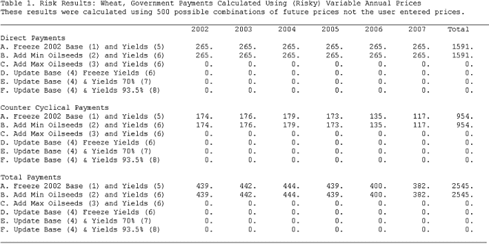
Report: Annual Payment for First Crop
- Payments calculated using risky prices and CC payment rates
Report: Annual Payment for Second Crop
Report: Annual Payment for Third Crop
Report: Annual Payments for All Crops
- Sum of government payments by alternative for all crops
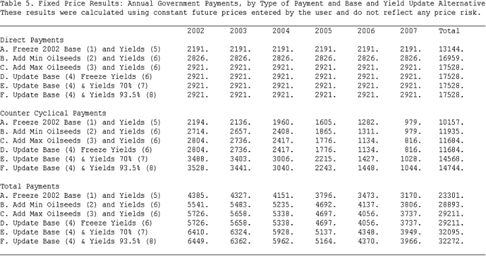
Report: Annual Payments for Constant Price Scenario Presented for Each Crop
- Payments calculated using producer’s constant prices and CC payment rates
Report: Total Annual Payments Calculated for Constant Price Scenario
- Sum of government payments by alternative for all crops
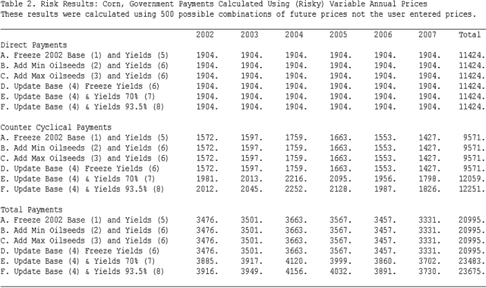
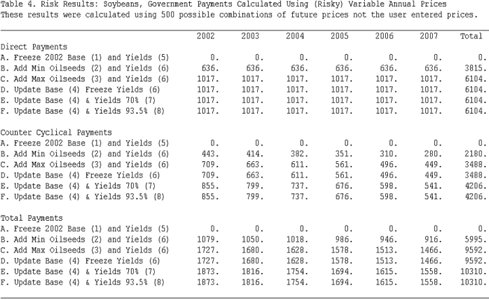
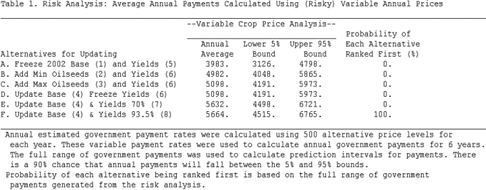
Report: Table Summarizing Risk Results by Alternative
- Ranked based on the number of times Alternative earned most govt. payments over the 6 year planning horizon (NOTICE: 100% on Alternative F)
- 90% confidence intervals shows risk on payments
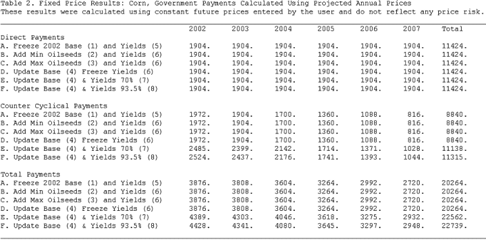
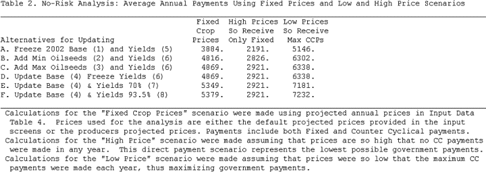
Report: Table Summarizing Constant Price Results by Alternative
- Constant price scenario is reported in column 1
- If prices are so high there are no CC payments in column 2
- If prices so low CC payments maximum each year in column 3
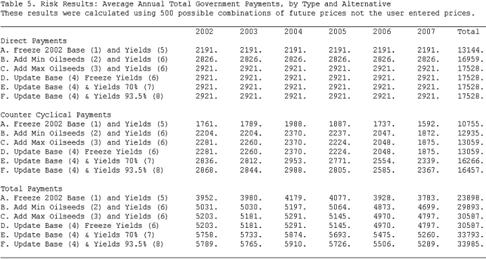
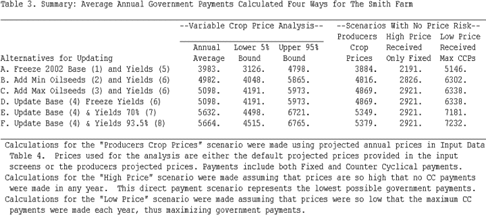
Report: Side-by-Side Comparison of Risk and Constant Price Scenarios
- Side-by-side comparison of Risk and Constant Price scenarios and the max and min payment scenarios
Report: Risk Graph of the Risky Price Analysis
- Risk averse decision makers prefer the alternative further to the right — E and F in this case near indifferent
Report: Printing a Printable Output
- Create a printable report in pdf format that can be saved or printed immediately
- Go back and change the data for this farm or modify this farm for a similar farm unit
- Revising the data and re-running retains existing information for the farm’s crops
Report: Sample of the PDF File Created by BYA for Printing or for Storage
Report: End of the Report
- Also at the end of the Report screen the user can access the documentation and get more information about the updating options
- Information on price and CC payment rate risk is also available at this point

Demand for the BYA Decision Aid
- The AFPC BYA was first made available on our web site in mid July on a limited basis to our testers
- FSA in Washington
- Texas Extension Specialists and County Agents
- Revisions were made to improve completeness of output
- Presentation at the FSA National Training on Base and Yield Updating on July 26th
- Usage on the BYA really took off after that
- We get dozens of calls and e-mails a day from all across the US asking for CD version, and explanations
BYA Usage Since August 1st
- Number of Unique Visitors 16,601
- Number of Visits 25,924
- Page Transferred 312,776
- Hits on BYA Page 528,995
- All stats as of 12 p.m. Sunday August 25, 2002
BYA Use by State Since August 1st
BYA Use by Crop Since August 1st, Irrigated (I) and Non-Irrigated (N)
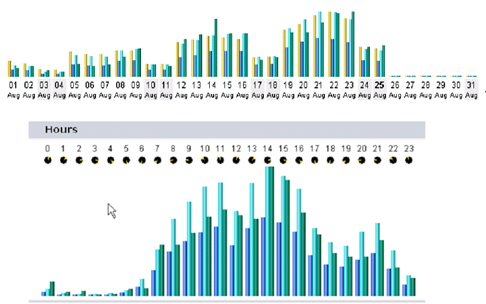
Daily BYA Use Since August 1st
Summary
- We do not intend to put out a CD version
- We will continue to work with FSA to keep calculations correct with respect to the rule changes
- We will release a peanut version in October or sooner, we are waiting for the rules to be finalized
- We are working with FSA in Kansas City to put this on their web site and in county offices for batch processing