Vol. 27, Issue 5, February 14, 2011 – PDF version
Jose G. Peña, Texas AgriLife Extension Economist-Management
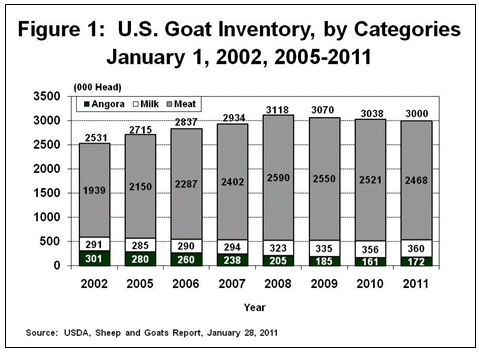
The size of U.S. all-goat inventory decreased for the third year in a row after the recent inventory high in 2008. While the inventory of Angora and milk goats increased, the biggest influence in the decline in the size of the U.S. goat herd was a 53,000 head decline in the inventory of meat and other goats which comprise about 82 percent of the total U.S. goat herd.
The size of the Angora goat herd increased 6.8 percent after steadily declines since the mid-90’s when the wool and mohair incentive program was terminated. Angora goats now account for only about 5.7 percent of the total U.S. goat herd, compared to the early 90’s when the Angora goat inventory accounted for about 97 percent of the 1.8 million U.S. goat herd.
According to USDA’s January 28, 2011 Sheep and Goats report, the all goat inventory in the U.S. on January 1, 2011, totaled 3.0 million head, down 1.3 percent from January 1, 2010. While the inventory of Angora and milk goats increased by 6.8 percent and 1.1 percent respectively, the inventory of meat and other goats decreased by 2.1 percent (See Figure 1).
In January ’06, it appeared that the liquidation of the U.S. Angora goat herd was slowing down as bids for Angora kids and mohair improved and were probably influencing the slow-down of the Angora goat herd liquidation. But, the industry has been unable to stabilize the size of the Angora goat herd. The Angora goat herd continues to decline as typical Angora goat producers retire, relatively weak prices for a large portion of the mohair discourages mohair production, major predation problems and scarce labor pools to harvest the mohair complicate management decisions. In addition, the hardier, more profitable aspect of meat goats has worked against the retention of a large Angora goat herd, especially as the shearing labor force thins.
The mix between Angora, meat and milk goats has changed dramatically during the last 18 years. While the size of the total U.S. goat herd is now 1.1 million head larger than the 1.9 million head U.S. goat herd in 1992, the size of the Angora goat herd has decreased over 90 percent compared to the inventory of meat goats which has increased about 570 percent.
Mohair Production Down, Prices Up
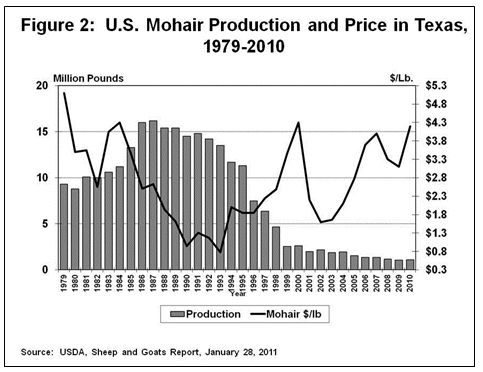
Mohair production increased to 1.085 million pounds during 2010, up 2.2 percent from 1.062 million pounds produced during 2010. While mohair production is up slightly, it is the 2nd lowest level since the last high in 1987. After dropping to record lows during the mid-90’s, prices for mohair made an excellent recovery in 2000, weakened during 2002 and have been showing some strength since 2008 (See Figure 2).
Almost all of the mohair is being exported. According to the latest data published by USDA-ERS, about 96.3 percent of the close to one million pounds (clean) exported in 2009, was exported to South Africa. The rest was exported to China.
Texas Leading State
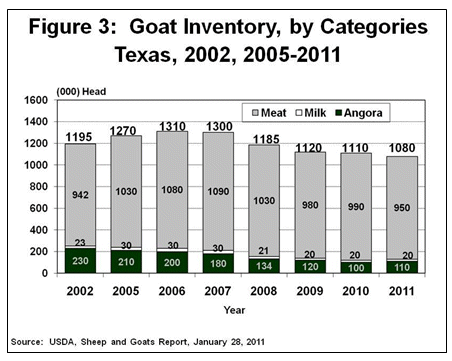
Texas dominates the U.S. commercial goat industry with about 36 percent of the U.S. inventory (See Figure 3). While the size of the Angora goat herd in Texas increased about 10 percent to 110,000 head on January 1, 2011, the size of the total goat herd decreased 2.7 percent to 1.08 million head. The inventory of milk goats at 20,000 head remained the same, but the inventory of meat and other goats dropped 4.0 percent to 950,000 head.
Texas continues to dominate the mohair industry, producing about 67.3 percent of the 1.085 million pounds of mohair produced during 2010, followed by Arizona with 11.1 percent, New Mexico with 6.9 percent, California with 1.8 percent and about 12.9 percent produced in other states.
Appreciation is expressed to Dr. Rick Machen for his contribution and to review of this article.


