
Grain Marketing White Paper 03-08 – May 30, 2008
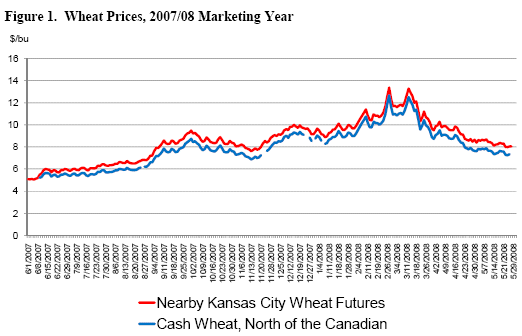
As wheat harvest hits full swing across Texas, producers are faced once again with the decision whether to sell their crop off the combine or to store in hopes of increasing the net selling price of their grain. For many, their memories of marketing last year’s crop are of selling too soon and watching prices rise to record highs during the winter. Now, even as prices have fallen back from these all time highs, the current cash price is the highest ever seen at harvest and is $2 per bushel above the price last year at this time (see Figure 1). But world grain stocks are still tight and the prospect of production difficulties in corn could be the catalyst to drive grain prices higher again.
Two factors need to be considered when deciding whether to sell or store: 1) price speculation and 2) returns to storage. By segregating the effect each of these factors has on the expected net selling price, producers will be better informed in making the sell versus store decision. Price speculation, in which the grower accepts all price risk in the hope prices increase, results in increased returns when the price increases enough over time to cover storage costs and compensates the grower for the risk associated with possible physical deterioration of the grain. If you believe there are sound reasons to expect higher wheat prices, then there are alternatives other than holding wheat in storage that usually outperform a cash speculative program. One such alternative is to sell cash wheat at harvest and buy distant futures contracts. This eliminates not only the costs of storage but also the risk of damage inherent in storing the physical product.
Return to storage is an altogether different proposition than price risk. It is based on fixed current prices (both at harvest and for future grain delivery as specified by futures contracts) and the difference between these prices and the local cash price (the basis)/1. Return to storage is based on knowledge of basis levels for wheat in your area and the amount of premium in distant futures contracts relative to harvest-time futures. Some of the factors that affect the basis are the costs and availability of storage, transportation costs, interest, and developments in underlying supply and demand fundamentals. There is always the risk that the final basis will not be equal to the expected basis because of changes in these factors. This is referred to as basis risk and must be accounted for in any sell versus store decision.
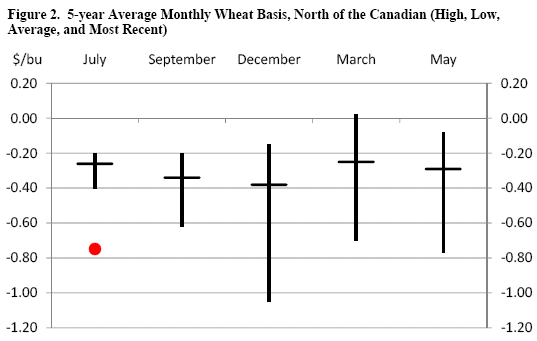
Figure 2 shows the range of the basis for the last five years (2003 to 2007) in the area North of the Canadian/2. This chart shows the minimum, maximum, and average wheat basis (amounts by which the local cash wheat price was below the nearest futures contract) in the months of June relative to the July Kansas City wheat contract, August cash relative to the September contract, November cash relative to the December contract, February cash relative to the March contract, and April cash relative to the May contract. The red dot shows the most recently recorded basis for the 2008 wheat harvest, -$0.73 cents per bushel. The low points over the last five years of each month’s basis range all occurred in the 2007/08 crop year. The current basis is lower than last year’s July basis by about 40 cents per bushel.
Returns to storage are favorable when basis improvement (from weak at harvest to stronger later in the off season) is expected to be enough to compensate for storage charges. This can be expressed as a storage decision formula:
Returns to Storage = Expected Price – Today’s Cash Price – Storage Costs
where the expected price is the distant futures price minus the expected basis for that contract in your area at that time of year. Store the crop when the returns to storage are positive and sufficient to justify the acceptance of basis risk.
You can estimate the returns to storage for any crop at any point in time by filling in your values into the following table (Table 1). This example is based on prices at the time of this writing and estimates the returns for storing wheat harvested in June and making cash sales in either August (using the September futures contract), November (December futures), February (March futures), or April (May futures). In this example, the future price of the stored grain is locked in either by being hedged in the futures market or by a forward cash contract. If you store and do not forward price, the return to storage will be affected by changes in the futures price. Given the weak basis we experienced last year and the fact that current basis levels are below the five-year average, I chose to use as my expected basis the maximum recorded in the last five years for November, February, and April cash sales. For August cash sales, the maximum (weakest) basis of the last five years (-$0.62) is stronger than the current basis. From looking at the data, I do not expect basis to improve as we move from June to August, so I used the current basis of -$0.73 for my August cash sales calculations. Storage costs in this example are 6¢ per bushel per month (an estimate of commercial storage and interest costs).
As the results in Table 1 show, returns for storage are negative North of the Canadian at these prices for cash sales in November and April and just above break even in August and February. But these positive returns are only 2 cents a bushel which does not seem like much compensation for possible storage losses and the basis risk inherent in today’s volatile markets.
| Table 1. Estimated Returns from Storage, 2008 Wheat/3 | ||||
| Current Cash Price | 7.30 | |||
| Sep Futures | 8.16 | |||
| Dec Futures | 8.36 | |||
| Mar Futures | 8.49 | |||
| May Futures | 8.45 | |||
| Expected Cash Prices for later delivery: | ||||
| Store until | August | November | February | April |
| Futures Price | 8.16 | 8.36 | 8.49 | 8.45 |
| Expected Basis | -0.73 | -1.05 | -0.7 | -0.77 |
| Expected Cash Price | 7.43 | 7.31 | 7.79 | 7.68 |
| Returns to Storage | ||||
| Expected Cash Price | 7.43 | 7.31 | 7.79 | 7.68 |
| Minus Today’s Price | 7.30 | 7.30 | 7.30 | 7.30 |
| Minus Storage Costs | 0.12 | 0.30 | 0.48 | 0.60 |
| Total Return | 0.02 | -0.29 | 0.02 | -0.22 |
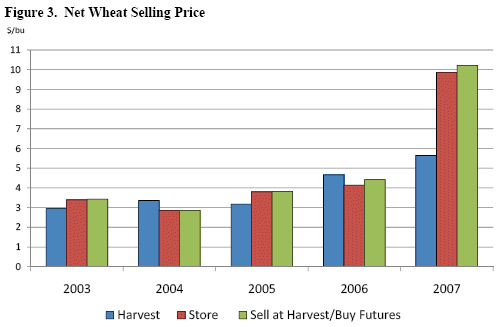
How often are returns to storage positive? Figure 3 compares the net selling price for wheat in the February following harvest in the area North of the Canadian for the last five years. The three marketing options compared are cash sales at harvest, storing grain and selling in February, and sell cash wheat at harvest and buy March futures. Selling grain at harvest resulted in the highest net selling price in 2004 and 2006 and the lowest net selling price in 2003, 2005, and 2007. However, actually holding the grain in storage and selling in February resulted in a lower net selling wheat price compared to selling at harvest and buying futures in 4 out of the 5 years. In the year storage did not decrease returns (2004), it netted the same price as the futures strategy. Returns to storage for wheat are not generally positive and when they are, do not significantly improve the net selling price. These calculations do not include grain shrink, quality discounts, or commissions.
In making your sell versus store decision, it is important to distinguish between price speculation and the return to storage. If your motivation for storage is price speculation, there are more efficient ways to participate in the market than grain storage. If you think the opportunity exists to increase crop returns from returns to storage, an understanding of your local basis is the key.
Notes
1/ Basis is defined as the difference between the local cash price and the relevant futures contract price and is calculated as basis = local cash price – futures.
2/ See Figure A1 in the Appendix for more details on this area.
3/ These calculations do not include commission costs or interest on margin call
funds.
References
Brees, Melvin. “Harvest, Sell or Store Decisions”, Decisive Marketing, Food and Agricultural Policy Research Institute, University of Missouri, August 17, 2007.
Fortenberry, T. Randall. “Grain Storage in Wisconsin—Pricing Your Options”, University of Wisconsin-Madison, September 12, 2005.
Purcell, Wayne D. Agricultural Futures and Options, New York: MacMillan Publishing Company, 1991.
Appendix
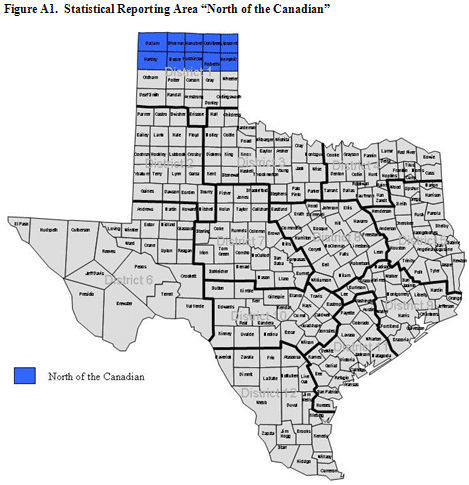
Counties: Dallam, Hansford, Hartley, Hemphill, Hutchison, Lipscomb, Moore, Ochlitree, Roberts, Sherman
Planted acres 2007/08: 1,070,800 (17% of state total)
Production in 2007/08: 140,600,000 bushels (29% of state total)