AG-ECO NEWS
Vol. 24, Issue 23, August 20, 2008 – PDF version
Jose G. Peña
Extension Economist-Management
Corn Production Forecast 2nd Largest Crop on Record, Cotton Down 28% and Soybean Up 15%; Grain Markets Improve; Cotton Trading Sideways
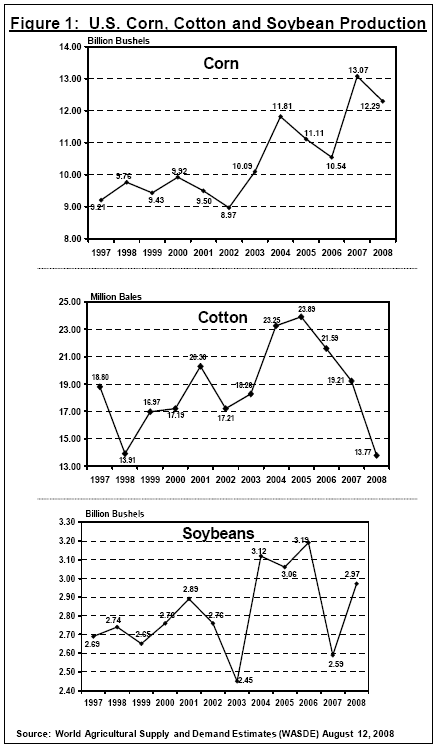
USDA’s first survey based crop production forecast for 2008, released on August 12, 2008, estimates that corn production for the 2008/09 season at 12.288 billion bushels is up 573 million bushels (4.9%) from last month’s estimate of 11.715 billion bushels, but down six percent from last year’s record crop of 13.074 billion bushels. If realized, this will be the second largest crop on record. The cotton forecast was down 28 percent from last year. Soybeans were up 15 percent. (See Figure 1). 
While grain markets strengthened after the recent weakness, the cotton market initially showed some strength but weakened shortly afterwards and appears to be trading sideways.
The corn market weakened after the recent highs as traders were anticipating a large crop. The market had improved with indications of a potential for a smaller than expected crop due to a slow start last spring and some acres lost to flooding while demand remained strong, especially domestic demand. Near ideal growing conditions across most of the Corn Belt since June improved crop development and increased yield prospects. While the report was bearish, the market moved up. Futures prices closed higher on the report release date and moved the limit up on the day after the report was released. This appears to indicate that the market may be responding to expectations of a lower crop size estimate in September, especially since the crop remains behind schedule.
Increased domestic use, especially for ethanol production continues to fuel the market. While prices for corn are lower than recent record highs, the corn market is continuing to provide excellent pricing opportunities for the 2008 and 2009 crop.
Futures prices for cotton moved to the low 70’s shortly after the August 12, 2008 supply/demand report was released but weakened shortly after, even with USDA’s slightly lower production estimate. Futures prices for cotton on the New York Board of Trade (NYBOT) had been hovering in the mid-50’s for many months, but shot up to about $1.00/lb in mid-March 2008 after the NYBOT was purchased by the International Cotton Council (ICC) and initiated electronic trading. After that market debacle, future prices settled to trade closer to fundamental supply/demand historical relationships. The more recent weakness appears to indicate that the market considers that USDA’s August production estimate may be on the high side of expectations.
Corn
USDA’s August 12, 2008 report estimated new crop production at 12.288 billion bushels, up 573 million bushels from last month’s trend yield estimate, but down 786 million bushels (6.0%) from last year’s record crop of 13.074 billion bushels. Based on growing conditions of August 1, 2008, USDA raised the average yield estimate by 3.9 bu/ac to 155 bu/ac, from last year’s average and up 6.6 bu/ac from last month’s trend yield estimate of 148.3 bu/ac. If realized, this will be the second highest yield on record, behind the 160.4 bushel yield in 2004 and the 2nd largest crop on record.
The corn crop is making excellent progress, but way behind schedule. While USDA’s August 17, 2008 corn crop condition report rated 67 percent of the crop as good-to-excellent, the same rating as the five year average, only 49 percent of the crop is past the dough stage compared to a five year average of 68 percent. This delayed crop development may be influencing the recent market improvement in spite of USDA’s August 12, 2008 bearish report. A lot of things may still affect the crop size.
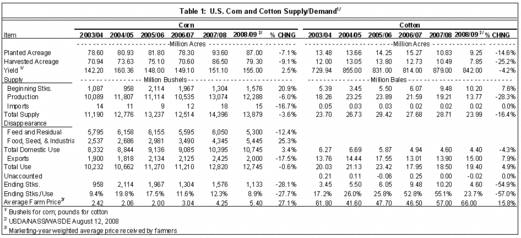
While the estimate of exports remained unchanged from last month, the estimate of feed and residual use was increased by 100 million bushels and corn use for ethanol was increased by 150 million bushels for a total domestic use increase of 250 million bushels from last month’s estimate. The estimate of use will exceed production by 457 million bushels. The estimates of ending stocks at 1.133 billion bushels are up 301 million bushels from last month’s estimate, but down about 443 million bushels from beginning stocks of 1.576 billion bushels. The season average price received by farmers is projected at $4.90 to $5.90 per bushel, down 60 cents on both sides of the range from last month’s estimate.
Globally, coarse grain production for 2008/09 was raised by 20.1 million metric tons from last month’s estimate to a record 1.089 billion metric tons.
Cotton
Meanwhile, the cotton market weakened slightly after the short period of improvement after the August 12, 2008, supply/demand report was released. While December ’08 cotton futures prices appear to be trading sideways in the mid-60’s with potential to move to the mid-70’s, USDA’s report was bullish for the 2009/2010 market seasons.
USDA’s first survey based production estimate, indicated lower production and higher exports compared to last month, resulting in lower ending stocks. The production estimate at 13.77 million bales was down 230,000 bales from last month’s estimate of 14.0 million bales. Domestic mill use remained the same but the estimate of exports was increased by 500,000 bales as lower foreign supplies increased demand for U.S. cotton. Ending stocks at 4.6 million bales are down 700,000 bales (13.2%) from last month, the lowest in five years, and down 55 percent from beginning stocks of 10.2 million bales. (See Table 1-click image to enlarge). 
Globally, the 2008/09 forecasts includes lower production, supplies, use and ending stocks as compared to last month. World beginning stocks were reduced by 900,000 bales and production was reduced to 112.2 million bales, down 2.4 percent from last month’s estimate.
USDA’s forecast price received by farmers of 60-72 cents per pound was narrowed by one cent on each side of the range.
